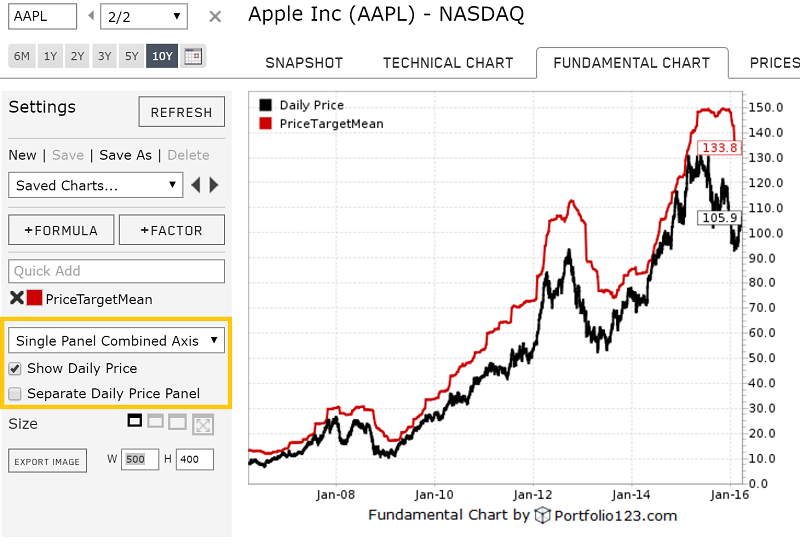
For fun try charting the mean price target in the Fundamental Chart. You will see how the analysts PT seem to simply react to price movement. Not sure of the value of these factors if any. Price targets are always derided by academics, however they are always mentioned in every upgrade/downgrade. Is it just for fools ? Is it just a lagging indicator?
In any case, do share if you find ways to use them. We could add more PT based factors, if there’s support for it.
I know FHist does not work well for EPS estimates but that is due to problems with which quarter/year the estimate is pointing to, I think. Seems like it might work for this?
Objectively speaking, target prices are completely meaningless, cosmetic fluff that even the analysts themselves laugh at. And it cannot be any other way. The lion’s share of how a stock moves is tied to the market and other macro factors. Simply forecasting a stick price, independent of any of these other things, is a ridiculous exercise. Yet firms who have to get analyst work product out there need anything they can to whip up conversation, so they still ask analysts for target prices.
Not surprised to see it move like an upper BB. When a stock runs through a target price, analysts are not going to say “Sell” as they would have to do if they took the number seriously. They simply raise the target.
If this data is to be made to work in a model, it would likely be along the lines of a sentiment gauge, as with estimate revision or as a relative thing. When I was at Value Line, I always worked with the 3- to 5-year target prices but did so ONLY by looking at projected percent gain for stocks versus projected percent gains for the universe (never in an absolute sense; in fact, I never even noted the price numbers – I went right to relative forecasted % change). You might want to try working along these lines with a bunch of FMedian or Frank type appreciation formulas.
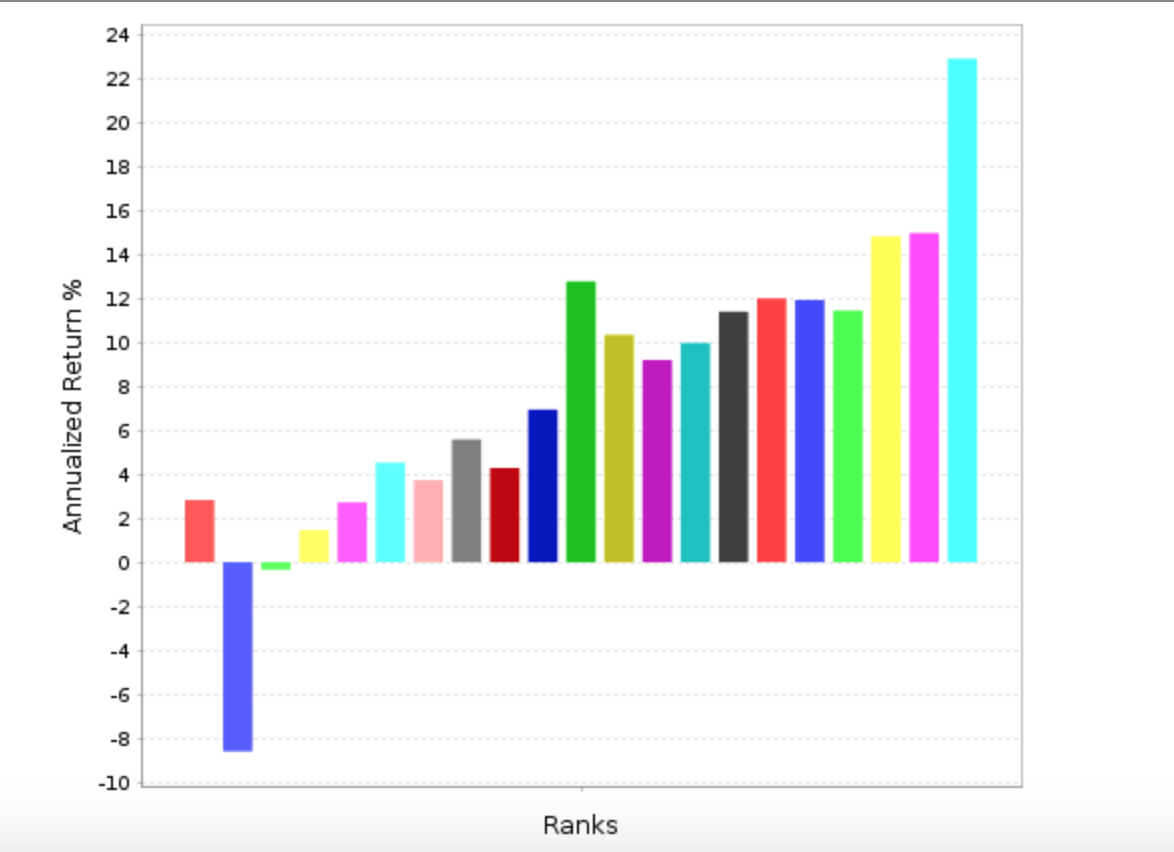
I also did a quick experiment against the R3000 universe. I picked the top 500 stocks based on a PriceTargetMean/close(0) quick rank and the bottom 500. The average annual MAX return was about the same (uninspiring) but the difference in Standard Deviation was huge. It was 16.78 (vs. 15.86 for the ETF benchmark) for the lower-is-better group, but a walloping 32.59 for the higher-is-better group. So perhaps target prices could be used as a risk control device, along the lines of: the more analysts pretend to expect, or rather, the more they deliver to their firms’ marketers, the more tightly you need to fasten your seat belt.
Please would you consider adding EPS estimates for “Year after Next”. I’m sure lots of us are aware that at year end, “Next” becomes “Cur”, and “Year after Next” becomes “Next” (often with a 13 week history). In the last quarter of the year, visibility of “Year after Next” would be very useful. For most of the year, I imagine it is N/A because analysts haven’t made estimates, but in the last quarter some analysts will start making estimates.
The above comments got me thinking that PriceTargetMean behaves much like a momentum indicator. So I tried the following in a sim in place of the usual Close(0)/Close(Y bars ago)
It mainly reduced the drawdown a good amount and improved the Sharpe Ratio. But it also increased the annual returns and improved the average return per trade in the trade statistics. There was improvement with any x value from 1 to 9 that I tried.
My thinking is that it prevented me from buying stocks with the highest momentum that had outpaced the analysts expectation: volatile stocks with high beta in a down market. But I have not really checked this.
Caveats: it worked best with short or intermediate Y (bars ago). Make sure to use the eval or there will be a lot of randomness due to the NAs.
I am interested in any thoughts–if anyone tries this. Useful or just over-optimization?