As part of our estimates enhancement we added consensus sales estimates for Current & Next fiscal years. The new factors, found in the ESTIMATE section, for Current & Next Fiscal Year : Mean; Mean 1w, 4wk, 8wk, 13wk ago; Median ; StdDev ; # of Analysts
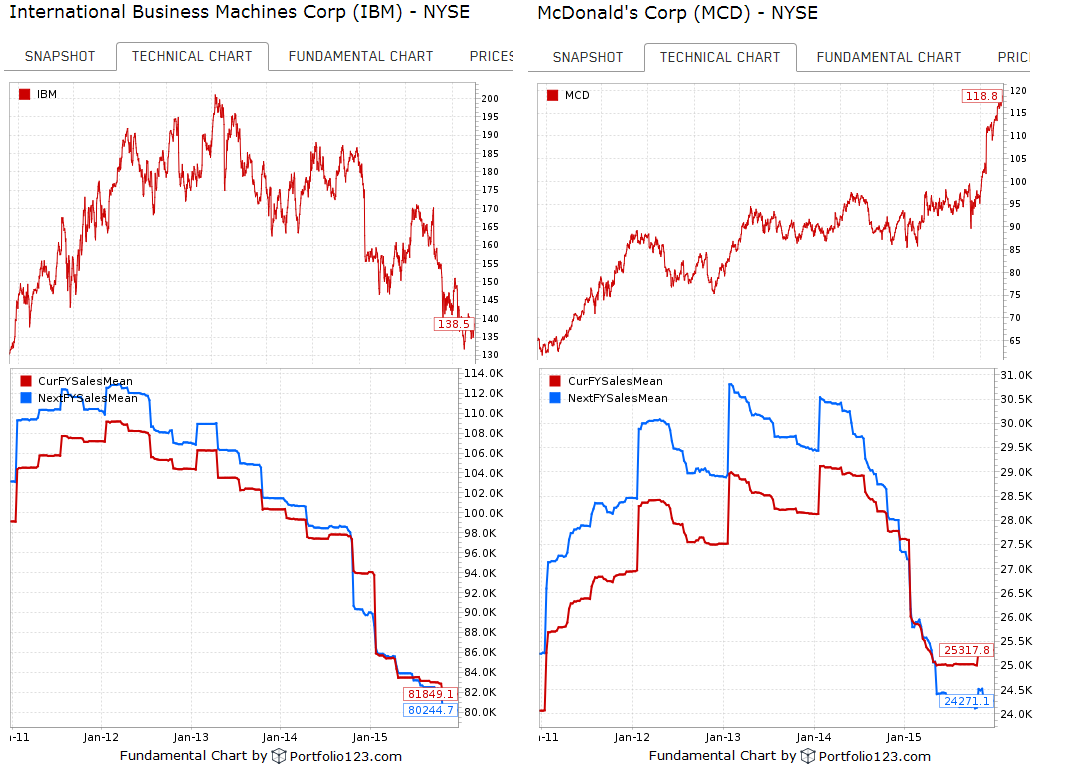
Here’s a 5 Year fundamental chart of CurFYSalesMean vs. NextFYSalesMean, and prices, for IBM & McDonalds. I picked these because they are both showing similar patterns in the estimates: declining sales estimates and recent flip-flop with Curr & Next year (sales for next year - blue - are projected lower than current - red). However the prices are doing the opposite. Strange.
Anyway, other things to notice is the “hand-off” that occurs when the 10-K is filed when NextY becomes CurrY. It’s more noticeable with MCD
Thanks very much for this and p123’s continuing efforts both to add and improve its data and tools.
Regarding sales estimates, is it possible to comment on the reliability or completeness of the data stretching back? For example, would there be reasons to think that recent data might be more reliable than data from 1999-2004? Would there be more instances of missing data in earlier years?
All best wishes to you and the staff for a great 2016.
Very happy to have the sales estimate data. Question: will you make this available on the company panel pages? I have looked for it there but don’t find it. Am I missing something?