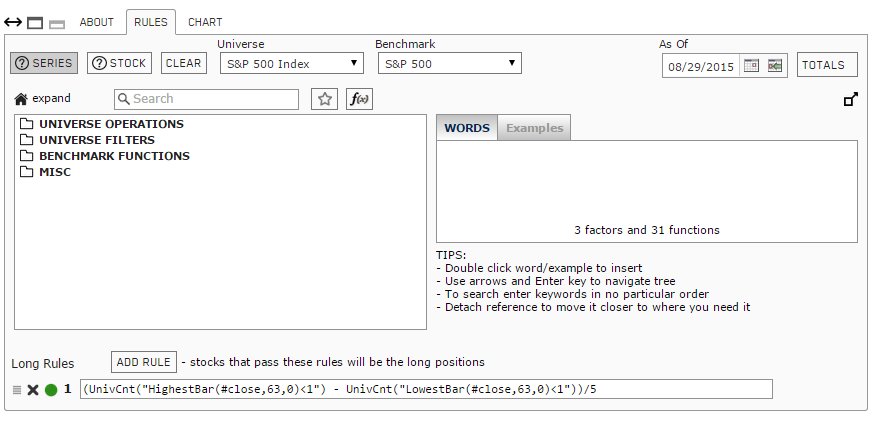
Trying to repeat his result, I created the Hi_Lo_3m custom series (see screenshots below) which seems to generate a chart behaving as expected. However when using this custom series in a screen (or sim) it does not generate any buying signal until the very end (the last year or so). What am I doing wrong?
Hi Steve, thanks, but that doesn’t explain why the screener only chooses data from 2014, clearly - as the custom series chart shows - the screen result should have been positive much earlier even if data started in 2011.
BTW when trying to change the chart to 1999 doesn’t work - it immediately bounces back to the 2011 date.
Still, clearly there is a way to do it, the article even shows P123 sim screenshots. What are we missing?
oops - got it, I neglected to save.
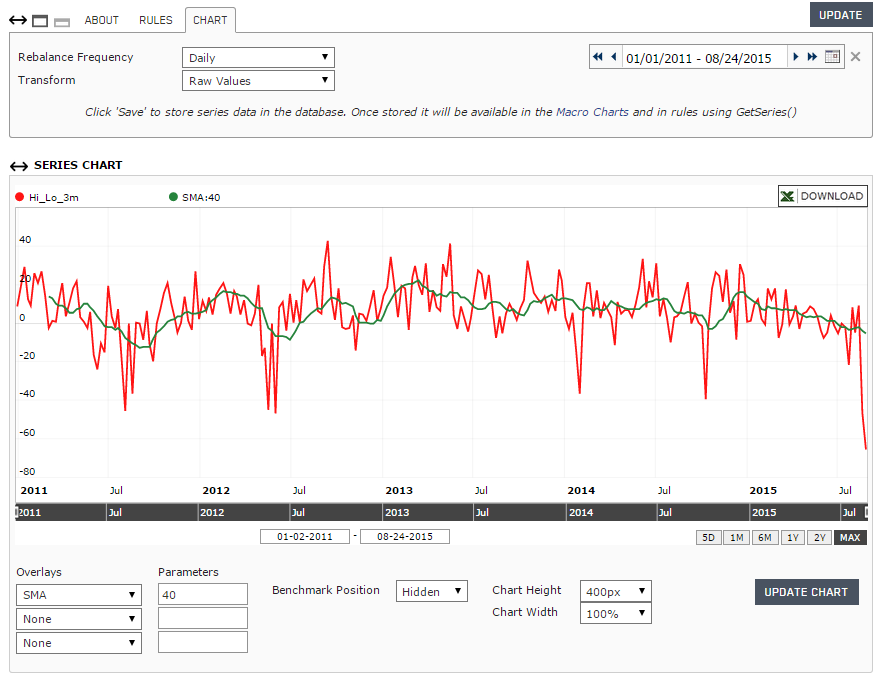
Once saved you get the full range of the chart which in this case is 2011 (+40 days). Here is the modified screenshot. Now the remaining question: Why wouldn’t it allow me to set dates before 2011?
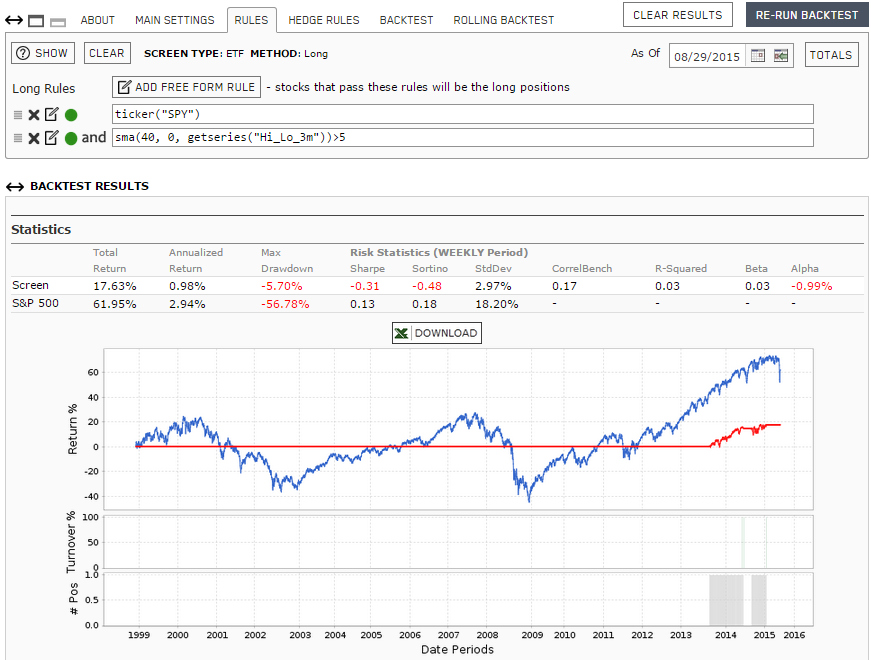
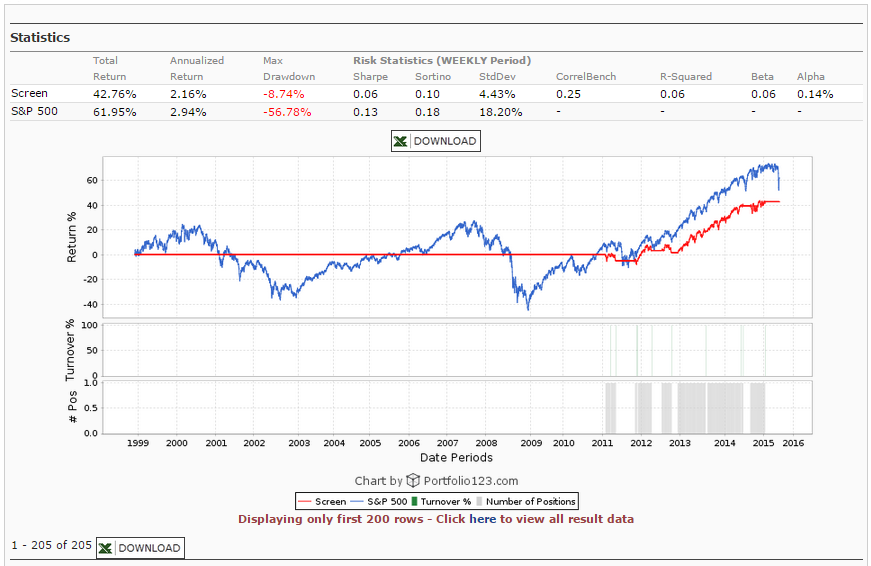
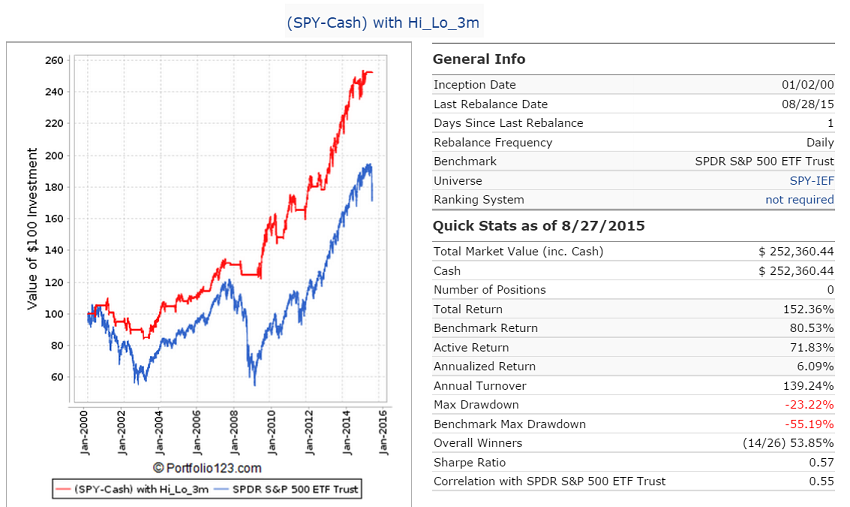
You need a sell rule as well. My series formula is a bit different, but your formula also works with a trigger value of 4.7%. With daily rebalancing and no trading costs the performance is shown in the picture and is the same as for my model.
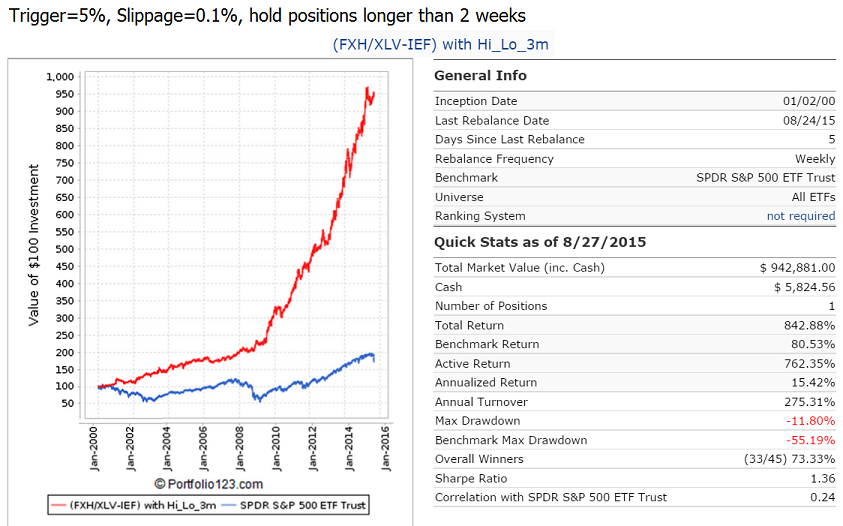
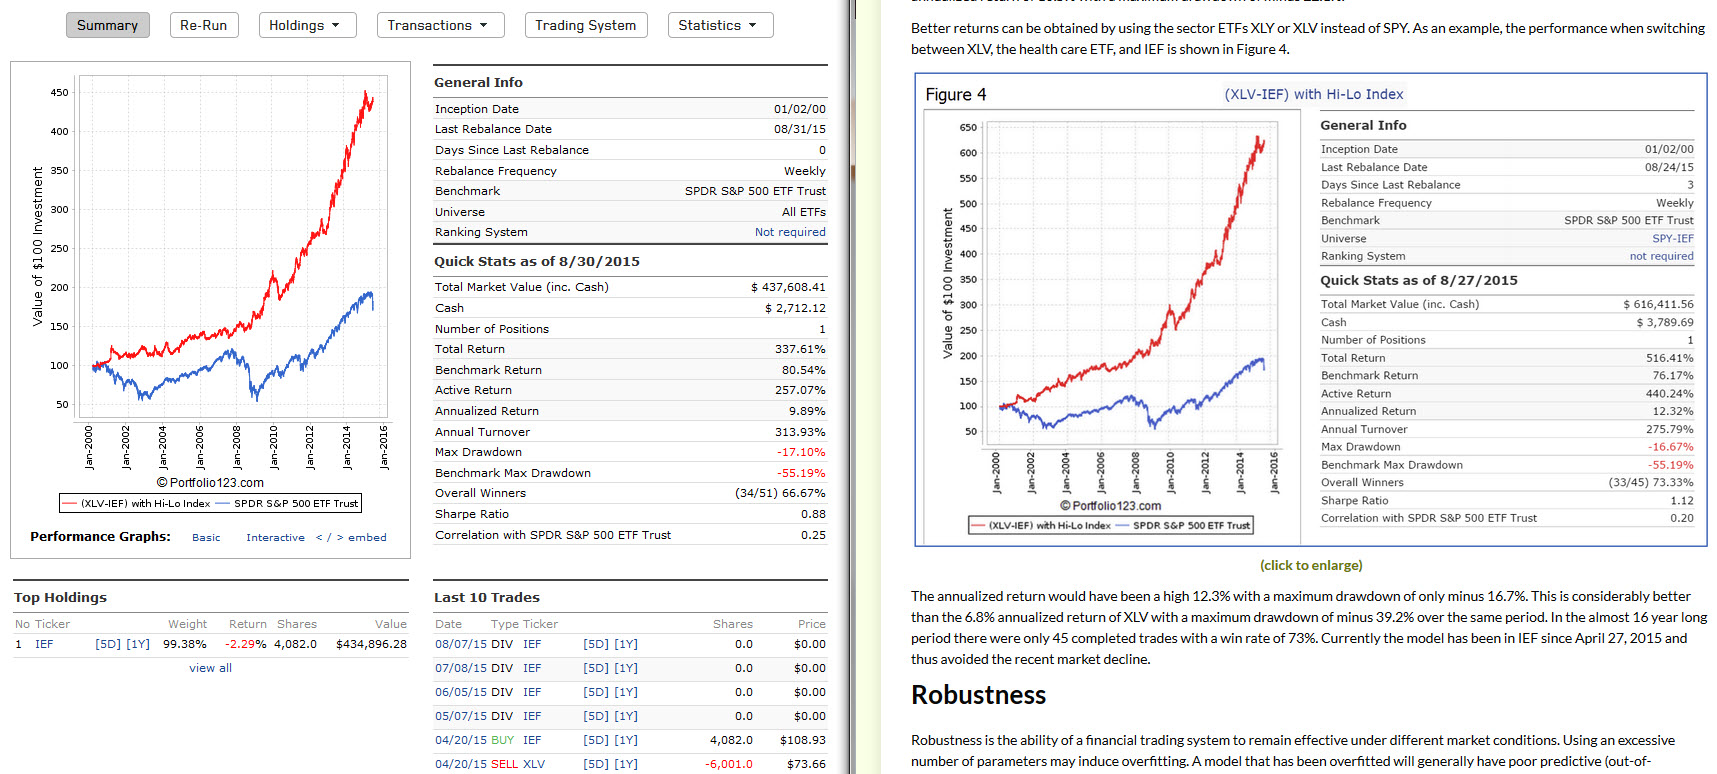
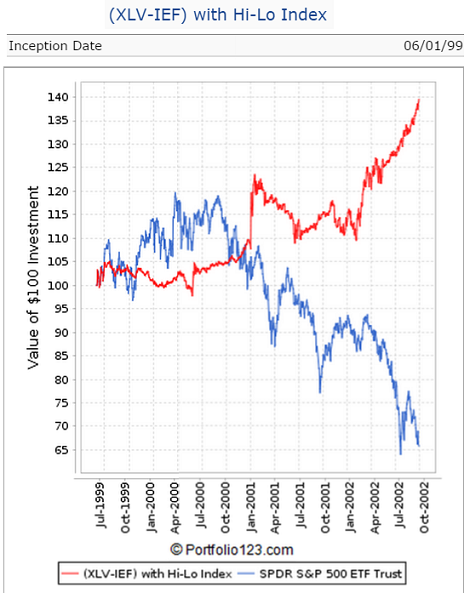
And here is a nice performance of the healthcare ETFs. Uses FXH and prior to FXH inception uses XLV. When not in the healthcare ETFs it switches to IEF. Return is 15% with max drawdown of -12%. Anybody should be happy with this performance seeing there were only 45 trades over the last 15.7 years.
Thanks George, very nice and simple system.
But I still cannot get P123 to go back beyond 2011 with the custom series, I wonder why. With my series P123 reverts the start date back to 2011 whenever I try entering an earlier date. Do you have your series set to 1999 and P123 accepts that, else how do you get the backtest to go all the way to 1999?
Sell rule: Since your article suggests simply using a fixed threshold, then a P123 Screen should do it, Screens have an implicit sell and just rescreen every week. Of course a sim has more options and require explicit rules but I am not there yet, I just want to see the general response curve.
Your buy rule is wrong. I am using your custom series with trigger value= 5%.
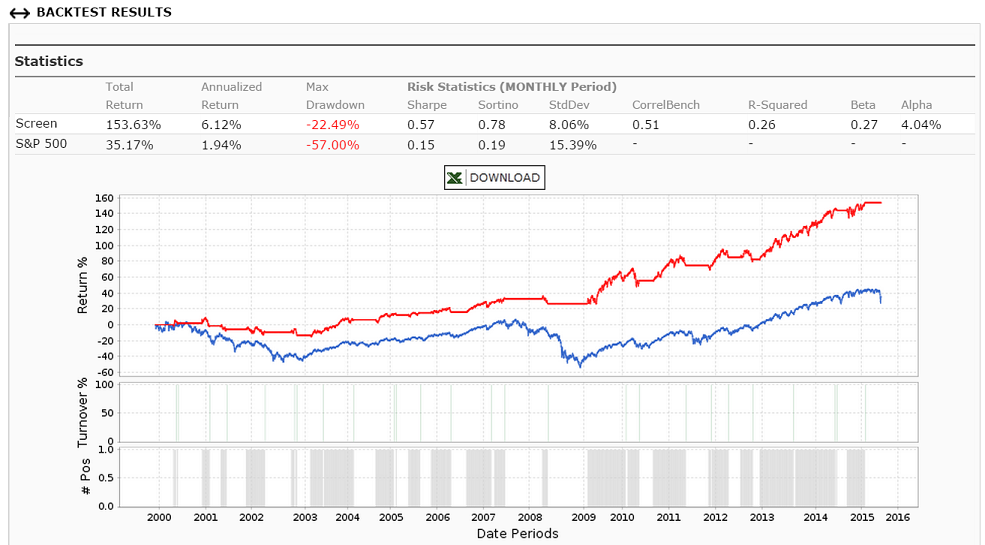
Here is my screen with transaction costs set to zero and weekly rebalance. Return is the same as for the sim.
Hi George,
Nop, my result from 2011 and onwards are pretty much identical, pixel for pixel on the image, to the image you posted so the buy rule is probably correct. You can try it by copying and pasting the images (with some scaling) into a good pixel editor. The problem has to be related to P123 not providing access to data prior to 2011 for whatever reason, maybe something wrong with my use of custom series, or maybe an account setting or another error. Perhaps Marc Gerstein or Marco can offer an answer here.
BTW to everyone who is following this interesting take on timing: Changing the custom series to SP1500 and using EMA (with some adjustments) seem to be even better, but they are all good. Indeed this indicator, which can be called “general stock market mood” is a powerful one. It makes sense that a breakdown will be proceeded by an extended deterioration of the general mood. That doesn’t cover all possible instances of a breakdown but it is useful nevertheless. Nice work.
Thanks George, but the buy rule above is functionally identical to the screen I posted at the start of this thread. It (naturally) also produces the exact same result to the last digit. The problem must be in the series, hopefully Marco or one of his team mates can shed some light on why I am only getting a series that starts in 2011, not before. Maybe I am doing something wrong, or maybe because I have one of the old gold accounts, it may have some inherent limitation, or a bug …
Still, your timer is simple and powerful, thanks for that idea. And even if there is an account problem to some users, that only limits past back-testing. We have a signal since 2011 and moving forward the indicator can be used regardless of such limitation.
in the below screen capture is my XLV-IEF sim on the left compared to the one on the website to the right. As you can see, my performance and winner rate is lower than the one published on the website.
In my sim I used 0.1% slippage, 5% trigger, minimum two weeks holding (nobars>10) and next open price, and my last trigger occured on 20 April 2015.
My questions:
Why is my performance so much lower?
How do you replace XLV with FXH? I used the following buy rules, but the sim only picks up XLV…
Rule 1: Ticker(“FXH,XLV,IEF”)
Rule 2: Eval(SMA(40,0,getseries(“SP5003moHL”))>0.05, Eval(Ticker(“FXH”),Ticker(“FHX”),Ticker(“XLV”)), Ticker(“IEF”))
This high-low timing strategy did not work well for 1999. How robust do you think it is for the future?
Z. - Does your P123 membership allow you to backtest to 1999? If so you should be able to get the same results in the screener as I did. If not, then this is something for the P123 team to sort out for you.
Florian,
I used average of high and low as the transaction price.
The series starts in Jan-2-1999, but I am not sure that P123 has data from Oct-1-1998 available to calculate the 3-mo series. Also the 40-day moving average is equivalent to an 8-week average. Therefore the earliest date that you can have reliable data is from June 1999 onward. Actually it performed o.k. during those early years as one can see from the screen shot.
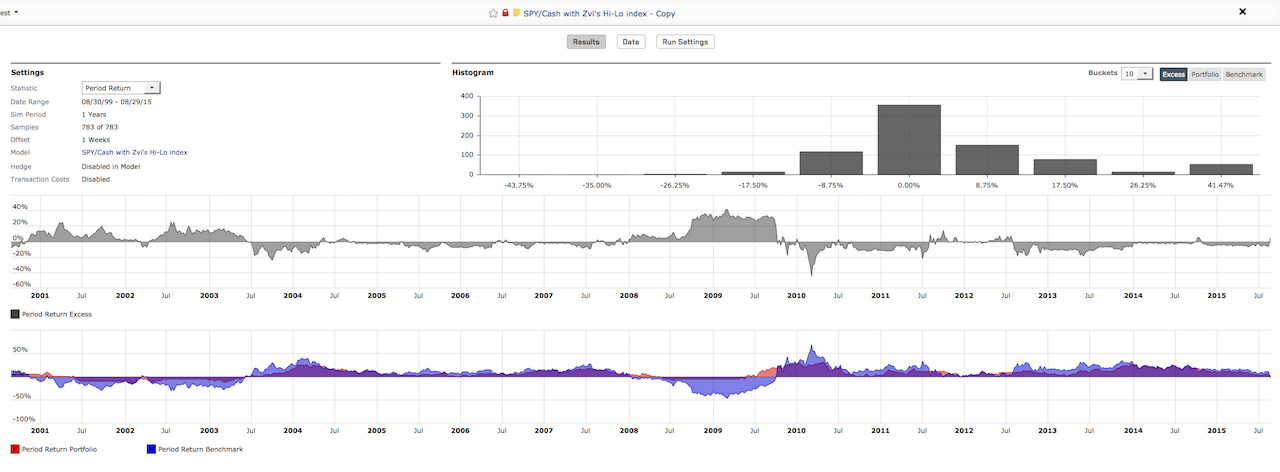
Interesting timer but it seems very sensitive to the SMA setting. As an exercise, I ran my version through the rolling test. With a one year holding period and weekly offsets, I get mostly 0% excess returns. Can anyone confirm?
George, yes I run all my backtests from 1999, no problems. Still, this custom series only starts from 2011 and would revert the start date to 2011 whenever I enter an earlier date. Accordingly the screen or sim using it doesn’t buy before 2011 (+SMA period). Maybe a bug with P123 for some accounts. I am sure other users have the same problem. Looking for feedback from Marco about that.
Z.
The results are a bit better with the IEF/SPY pair and a fixed slippage of 0.25. But most of the excess returns are still around 0%. The biggest differences now is that there is a +ve skew to the excess return distribution. However, even that goes away if I run with variable slippage. I’ll play with it some more later tonight. Thanks!