Small caps have done much better than large caps over the past decade. I’m wondering if anyone on this site is wondering if the secular outperformance may be over?
Hi,
Actually, the outperformance of small-cap stocks goes back much further than the last decade. In fact, a few years ago, Ibbotson and Associates conducted a study of the return from various market cap stocks going back to 1927. The result was that small-cap stocks outperformed large-caps by a ratio of 15:1. And small-cap value stocks outperformed general small-cap stocks 3:1.
You can read more about this study and the results of a similar Morningstar study at this link:
It’s unlikely that small-caps will ever stop this pattern of outperformance. The reason is two-fold: 1) The “law of large numbers” favors small-caps over large companies, and 2) Small-cap stocks are not covered by analysts like large-cap stocks are. Hence, when there is a catalyst that brings them to the public’s attention, investors will rush to buy shares as the small-cap company’s undervalued fundamentals are recognized.
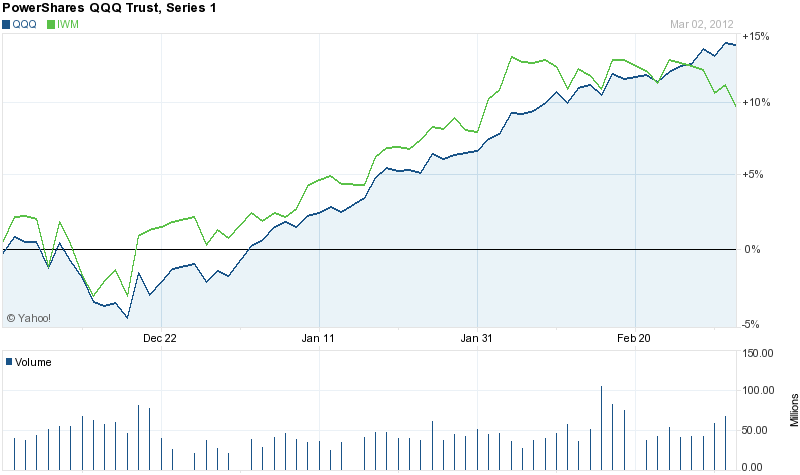
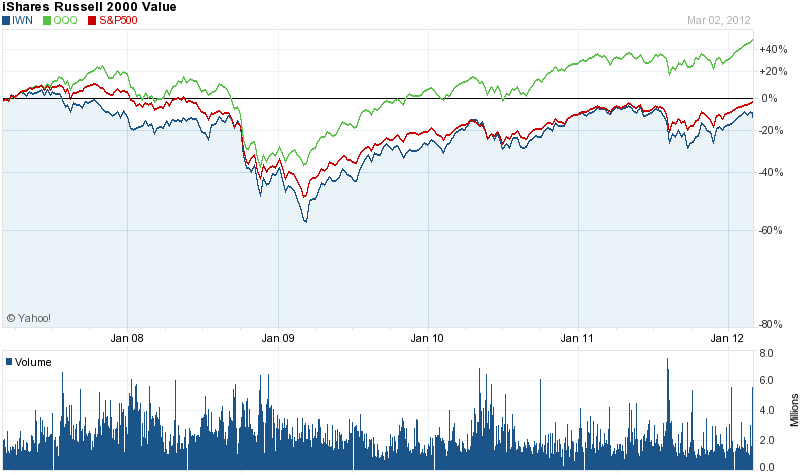
I’ve made my living off Fama and French but everything is cyclical. Just compare the SPX vs IWM for the past year. If you traded in the 1990’s you’ll know what I mean
Since 10/07/2011 when both SPX and IWM hit their low for the year, SPX is up about 18% and IWM is up about 23%
Denny ![]()
The “Long Run”
“In the long run the market is a weighing machine” - Ben Graham. Therefore, in the long run (over ~1.5 - ~5 years) eventually the cheapest asset classes will prevail.
For the record, the excess returns of small caps generally came in spurts. There were long periods in between when large beat small such as the 90’s as rmhi noted. The market cycle from 2000-2007 was a notable exception when small beat large year in and year out. It looks like people are taking the wrong lesson from this and thinking that the long term outperformance of small cap is consistently dependable.
Which size is cheaper right now? According to my favorite measurment large caps were clearly cheaper than small as of the end of January 2012, although not by a extremely large margin. Therefore in the long run (over the next 7 years) large (as a class) will almost certainly do better than small.
The “Short Run”
Of course we all want to outperform in the short run as well. And cheapness alone does not predict the short run. We can have fun guessing what will be more popular in the short run. Factors to consider include:
Cheapness
Volatility (one type of risk)
Risk of permanent losses
Past experience reinforcing certain theories and “disproving” others. (Which often causes mistaken sentiments. This explains why the stock market was considered safe in 1929, risky in 1950, safe in the 90’s as in “over the long-term stock prices always go up” etc.)
Plugging in these factors:
Large has a small edge in cheapness. It has a clearer edge in volatility and risk. (I am guessing that 2011 reminded people about the excess volatility of small caps.) On the other hand the unusually consistent outperformance of large caps from 2000-2007 reinforced the theory that small caps alway outperform on a consistent basis. As I mentioned there have been decades when this wasn’t so.
History Lessons
To illustrate how the short run and the long run interact, let’s examine history. The past two decades.
In the 90’s large caps outperformed small. The sentiment was that why take the excess risk of small when large caps are doing so well. It got so out of whack that even though small was already clearly cheaper by 1998 small kept getting even cheaper until 2000. By the year 2000 the PE of the S & P 500 was in the 30’s while the Russell 2000 was quite cheap. But although small caps were so cheap they were going still going nowhere and were extremely unpopular. Then, finally, when the bubble popped in 2000-2002 small caps were so cheap that they were almost immune. They continued to beat large caps consistently until 2007. In 2009 small caps again led the way as they usually do after a crash; having fallen harder than the large caps.
(Why were small caps so cheap in 2000?
Contributing factors may have been:
- Many of the large caps were overpriced tech firms, and even the large firms that were not tech were buoyed up because they were in the same asset class.
- People may have gotten reminded of the excess volatility of small caps during the Asian Crisis etc. in ~1998 and were scared away.
- Small caps underperformed during the great bull market of the 90’s as rmhi mentioned, so people just assumed that large caps would continue to outperform; much as people are assuming now that small caps will continue to outperform. Such assumptions cause bubbles.)
Chip
P.S. A possible additional (probably minor) factor to consider: Since 2009 large companies are growing earnings faster than the small ones, perhaps due to the burdens of regulations which are easier for large companies. Think about it: How many mom and pop operations were granted exemption from the new ObamaCare regulations as compared to large companies like McDonalds etc?
RMHI,
The shift you are identifying is not really ‘secular’ if you are just looking at 5 years. 5 years qualifies as a possible short trend, but trends can be very transitory.
The bond industry and the U.S. Treasury Bill industry historically have been immensely larger than the equity market. However, Helicopter Ben and his public commitment that the Federal Reserve will keep interest rates at effectively zero through 2014 have forced investors to seek out income-paying vehicles in other places. Since the market crash, that has primarily been large-cap, conservative, dividend-paying companies.
The trend you are identifying has nothing to do with a change involving small-cap stocks. It has everything to do with a very large number of investors’ desires to obtain income - not capital appreciation - from their savings. This demand for solid, dividend-paying, large-cap stocks is what has been running up their capital appreciation.
This is the trend you are seeing now. As the economy improves, the zero-interest monetary accommodation will be lifted. In fact, I caught several Fed Governors on CNBC this past week making this very point - apparently in an effort to forestall too much risk-taking by conservative income investors. When the Fed and other Central Banks around the world lift the enormous liquidity being pumped into the system and zero interest rates are lifted, then small-caps will return to their position as the most profitable investment vehicle for capital appreciation.
Regarding the first chart you showed which was of a couple of months of IWM beating QQQQ until IWM rolled over this this past week, well, that’s simply a bell ringing at the top of the rally that started last October. Time to take profits at the open Monday morning (at least with small-caps, that is). It’s not often that a bell is rung like this, so sell your small-caps and put tight dtopd on your others.
Other perspectives are always welcomed.
Chris
All good points. I can only add a little bit of color to your post:
The latter half of the 90’s was especially cruel to Value, even large cap value. It was a glorious time for large cap growth.
This leads me to the following conclusions:
- The effectiveness of P123 models, even those focusing on small cap value have still been superior despite the lagging small cap value class.
But even the p123 models have in recent years been in “spurts” rather than smooth and consistent as earlier in the decade. This will likely change again in the future.
IMO backtesting for 4-5 years may be a better indication of performance going forward than 11 years. So many models were front loaded in performance for when the large cap growth bubble burst in 2000 whereupon assets flew out of large cap growth and into value and small cap value. it was an extraordinarly situation and not likely to occur anytime soon. But if a model survived the last 4 years with decent returns and modest drawdowns, IMO its likely to do very well in a better environment going forward.
- Employing multiple models within a portfolio. I don’t have a clue when the next major move in small cap value will be. Hence diversification with multiple models is very important to me. This issue has been stressed on this site before, so there’s no need for me to venture there again. Despite my desire to point out the relative weakness of small cap value, my returns have been high enough not to abandon them. The “weakness” has been in small cap value indices not in our models, P123 has been a difference maker.
One simple idea would be to blend a small cap value P123 model with QQQQ’s or the QLD for an intermediate termed rally. Or be long large cap growth and long the TWM.
Chipper, by any chance is your favorite large cap/small cap value indicator the charts on www.gmo.com?
GMO works in 7-year time frames and has small cap expected return at -1.5% while hi quality is +5.0% per annum 7 years. I have issues with how GMO employs this kind of research so I don’t give it much attention.
Long TWM
rmhi I am impressed! You got it right! What are your issues with GMO (other than his radical political views)? Is your issue with using cheapness as a leading indicator altogether or is your issue with GMO’s valuation model in particular?
Chip
Whats the saying about a broken clock being right twice a day? I’m probably being harsh here and no doubt Jeremy Grantham is a very bright guy and all of us on this site should tip our hats to James Montier but I’ll take P123 over GMO managing my money any day of the week.
According to Jeremy, GMO uses a relatively simple Reversion to the Mean formula. But a reversion to the mean estimate would not have predicted a PE of 35 in 2000. The element of human emotions can rapidly propel a market higher than expected or impale it lower than you ever could have imagined. If you buy a index fund when market PE is 12 you may think its a great deal…until the market goes to 10 times earning and then you feel like a chump.
I prefer to trade a market trend rather that trying to predict the ultimate top or bottom.
I can’t predict what I’ll wear tomorrow let alone predict the stock market 7 years out. All I can be sure of is that tomorrow will be windy and cold and I’d rather be in St. Barts.
This is an interesting thread! I would like to add a little different prospective. In comparing the Russell 2000 to the S&P 500, although interesting, the P123 members don’t just buy either index and hold them. Otherwise they wouldn’t bother to frequent this web site. I think we need to consider that there are many just plain bad companies in the Russell 2000 that are run relative poorly and continually perform below the index average. Good P123 tools would never buy them, so I feel we need not consider them.
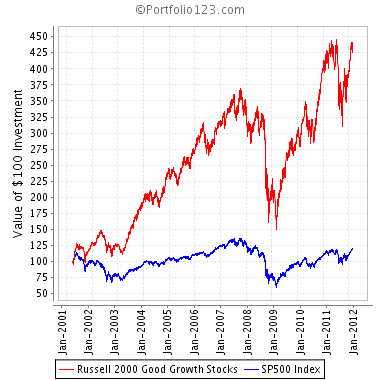
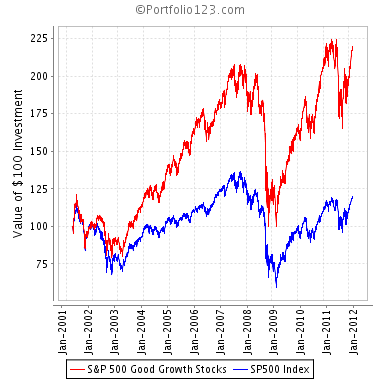
I created 4 Sims ran over the 11 year data set that I feel better compare the Russell 2000 to the S&P 500, at least for P123 members. I used the P123 Basic: Value & the Basic: Growth ranking systems for comparison. The Sims buy the top 500 Growth or Value stocks in the Russell 2000 and the top 125 Growth or Value stocks in the S&P 500 (Top 25% of each type in each index). There are no transaction fees, buy rules, and the stocks are all sold every 4 weeks with sold stocks allowed to be re-bought. The summery is:
Russell 2000 good Growth annual return = 13.88%; max drawdown = 59.14%; total return = 313.92%; Benchmark return (R2000) = 78.11%; Benchmark max drawdown = 58.01%
S&P 500 good Growth annual return = 7.21%; max drawdown = 52.09%; total return = 114.05%; Benchmark return (R2000) = 18.04%; Benchmark max drawdown = 56.3%
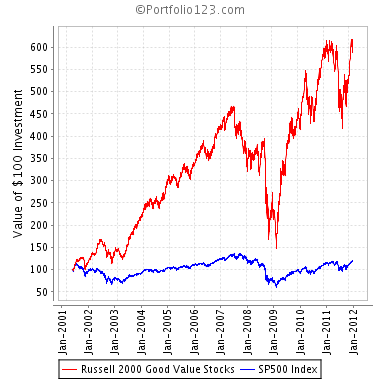
Russell 2000 good Value annual return = 17.33%; max drawdown = 68.18%; total return = 473.83%; Benchmark return (R2000) = 78.11%; Benchmark max drawdown = 58.01%
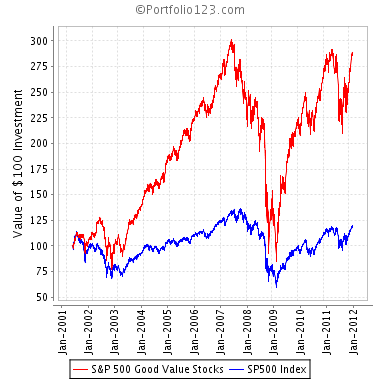
S&P 500 good Value annual return = 10.09%; max drawdown = 71.78%; total return = 185.93%; Benchmark return (R2000) = 18.04%; Benchmark max drawdown = 56.3%
The Sims are here in the same order:
Russell 2000 Good Growth Stocks
S&P 500 Good Growth Stocks
Russell 2000 Good Value Stocks
S&P 500 Good Value Stocks
Here are the Summery Charts in the same order:
Hi Denny:
Very helpful perspective to compare the best 1/4 of the R2000 and S&P500.
I assume the Benchmark for the S&P500 is the S&&P500 not the “R2000”.
Best regards,
Brian
Game.
Set.
Match.
Kudos Denny
Brian,
Yes you are right. It was the S&P 500. The R2000 was my error for a copy and paste oversight.
I would edit it and fix it, but P123 won’t let me after 1 day ![]()
Denny ![]()