We’re getting ready to formally add two new SP500 EPS derived weekly series.
#SPEPSQ : sum of the trailings 2 quarter results and 2 forward quarter estimates to create a 12 month EPS figure
#SPEPSCNY : a blend of the Current Y estimates and Next Y estimate depending on the latest Quarter filed. The exact composition is as follows (this is after the Q is filed):
Q4: 100% CY EPS
Q1: 75% CY EPS + 25% NY EPS
Q2: 50% CY EPS + 50% NY EPS
Q3: 25% CY EPS + 75% NY EPS
You can see these series compared to existing ones in the image below. The SP500 market highs and lows are shown. Also shown are areas where each series was giving false signals in the 20 and 40 week simple moving averages.
These series will be available by tomorrow. Remains to be seen how they backtest.
There’s an interesting article on Investopedia about using the P/E of a market index for timing purposes:
[url=http://www.investopedia.com/articles/technical/04/020404.asp#axzz1kW7j8Ms8]Financial Ratios
I’ve found that while earnings are important, they gain even more usefulness when used relative to price (the P/E ratio). Since you’re generously providing the EPS for the S&P 500, and the price of the index is readily available, it shouldn’t be much of a stretch to calculate the P/E of $SPX as another turnkey benchmark factor. Just an idea…
Thank you. In initial tests, I’m seeing better numbers overall in my “investable” quotients: i.e., although return is slightly lower, much better alpha, Sortino & Sharpe, and much lower portfolio turnover across multiple strategies.
I tried many variations in addition to the 5/21 sma’s, but still like the overall numbers on that signal ratio too.
So, overall, encouraging. My thanks to you for this work.
Please see attached spreadsheet for the calculation. We exclude Berkshire from the calculations because according to Compustat it switched the “primary” issue from BRK.A to BRK.B a while ago, and it messes up the calculations. It’s soemthing we still need to fully investigate, however the difference today is minimal. You can see both values, with & without BRK.B
As far as why we have 114 right now vs 120, I’m assuming that their version might be using all 2014 estimates. We make CurrFYEPSMean use 2013 until the company files their 2013. Maybe there’s a “standard” to switch what CurrFY means a few months before the filing. We’ll investigate.
Thanks Marco, it would be great to understand the discrepancy. The smoothest data seems the 52wk forward earnings which is visible in Yardeni’s pdf, that looks like the ideal data if valid.
In case it is useful to anyone, I tried to smoothen the SPEPSCNY further by doing it weekly, its not perfect, but…
The numbers will rarely, if ever, be the same. We’re using consensus Wall Street analyst estimates. The spreadsheet uses estimates from analysts who work at S&P (the folks who write up the S&P tear sheets). Not sure which are more accurate, not sure it’s been studied. But in a sense, that’s really irrelevant. We use estimates for models that help us pick stocks and the market, for better or worse, respond to consensus numbers; the ones we use.
Another factor is calendarization. The numbers on the S&P spreadsheet are completely agnostic as to which fiscal year a period falls into for a particular company. We think in terms of current and next. Ideally, and assuming cost is no object, it could be argued that calendarization is better. But again, it’s not clear that the theoretical purity of calendarization would produce better results than the structure we use, which is standard in much of the investment community.
I made a sim copy of a port hedged with an sma #SPEPSCY crossover. Fr the same time period (12/7/12 to present) I get an additional hedge period in the sim. The summer of 2013 is the culprit.
You can plot Close(0,#Spepscny) on the Data->Fundamental Chart. To use the Custom Series tool, I think you would need to reconstruct how #Spepscny is calculated.
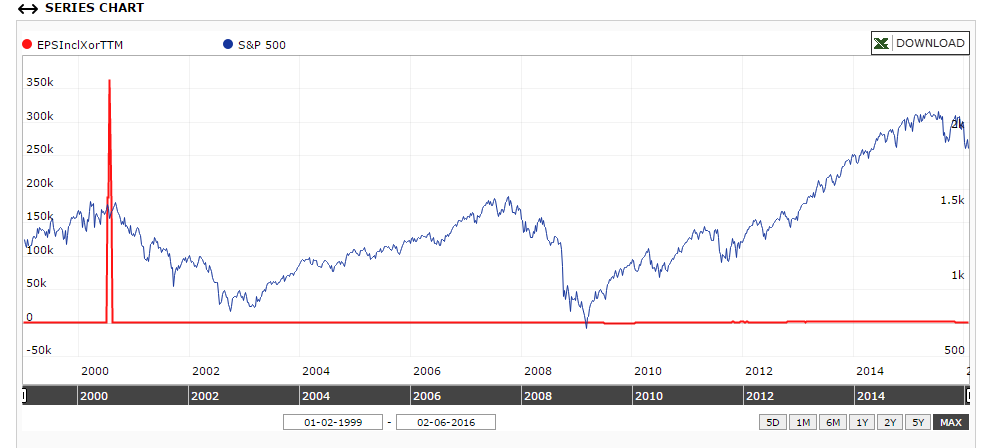
That jump is due to an accounting change of JNS.
See thread JNS July 2000 EPSExclXorTTM for details.
The S&P 1500 spike in July-August 2015 is from CABO.
I recommend you use this rule to filter these out:
[font=courier new]UnivSum(“EPSInclXorTTM < 10000”, “EPSInclXorTTM”)[/font]