Mathematically, what you’re looking for is a high correlation between the time period and the factor.
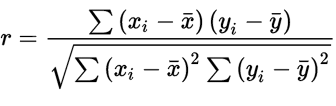
The formula for correlation is given in the image below.
If the x values are a simple series of integers, that simplifies the solution. It’s even simpler if the series of integers has an average of 0. For example, you can set x to the series -3, -2, -1, 0, 1, 2, 3.
Another thing that simplifies this formula is that the lower left term, the sum of the difference between the y values squared, is closely related to the formula for standard deviation (second image below).
So let’s take an example. Let’s say you’re looking for smooth growth of factor X over the last seven years. And let’s call the most recent year year 0 so that we can quickly plug this into our own P123 language. Last year will be year 1 and the year before will be year 2.
We’ll assign the X values like I just said: for year 0, x = 3, for year 1, x = 2, and for year 7, x = -3.
Then the denominator will be 3 * factor y0 + 2 * factor y1 + 1 * factor y2 + 0 * factor y3 - 1 * factor y4 - 2 * factor y5 - 3 * factor y6. We can ignore the average since that’s going to add up to zero.
The numerator will be the square root of (9 + 4 + 1 + 0 + 1 + 4 + 9) * standard deviation of the seven factors * square root of 7. And that equals 14 * the standard deviation.
So let’s say you want the correlation of annual sales growth over the last 7 years. The formula would be (3Sales(0,Ann)+2Sales(1,Ann)+Sales(2,Ann)-Sales(4,Ann)-2Sales(5,Ann)-3Sales(6,Ann))/(14*LoopStdDev(“Sales(Ctr,Ann)”,7)).
I’ve illustrated this in the following screen: https://www.portfolio123.com/app/screen/summary/270746?mt=1
As you can see, UnitedHealth (UNH) has an incredibly good, smooth sales growth. They’ve grown sales every year, and in more or less a straight line. So they get a number pretty close to 1 according to my formula.
On the other hand, IBM’s sales have been shrinking somewhat steadily. So they get a number relatively close to -1 according to my formula.