Posted by jasongoepfert on Twitter, this chart shows data is from P123. Any way to recreate it with our account?
Internal Nasdaq damage:
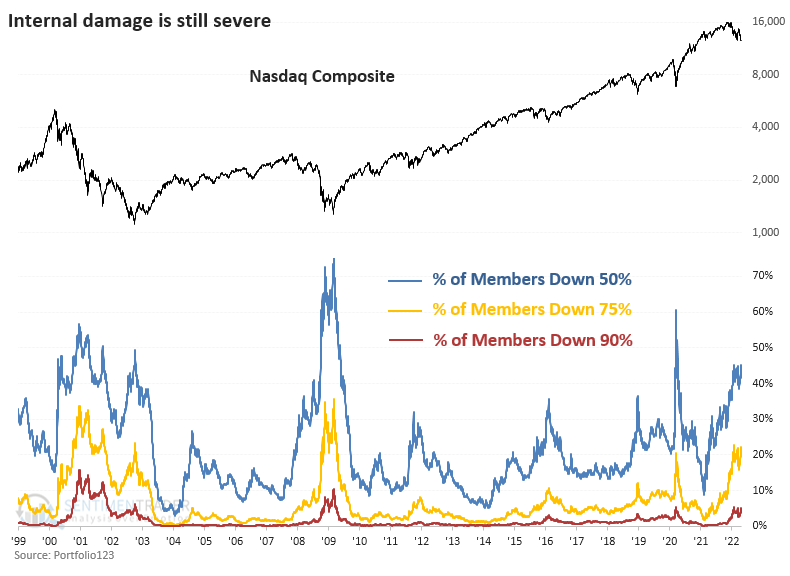
![]() More than 45% of stocks down 50%
More than 45% of stocks down 50%
![]() More than 22% of stocks down 75%
More than 22% of stocks down 75%
![]() More than 5% of stocks down 90%.
More than 5% of stocks down 90%.
Posted by jasongoepfert on Twitter, this chart shows data is from P123. Any way to recreate it with our account?
Internal Nasdaq damage:
![]() More than 45% of stocks down 50%
More than 45% of stocks down 50%
![]() More than 22% of stocks down 75%
More than 22% of stocks down 75%
![]() More than 5% of stocks down 90%.
More than 5% of stocks down 90%.
I think this will work:
Make a new aggregate series, select universe and set it to “Usa Other” and then select “NASDAQ Exchange”.
Set the Universe rule as:
100univcnt("Highval(250)(1-0.9)>price")/univcnt(“1”)
Here the “0.9” in “(1-0.9)” will count the number of stocks with prices 90 % lower than the max price over the last year(ish). Change it to (1-#whatever) to count the number of stock with prices #whatever % lower than the max price. Hope this helps!
Few things…
HighVal(250) is the high close price in the past 250 trading days (bars) which is an approximation for 1 year. If you want to use the high prices you need to specify it like this HighVal(250,0,#High)
If you want the highest price using the high prices for the past year using PriceH is a better option. It uses the high prices and precisely calculates 1Y using calendar days. It looks something like this with PriceH
100 * (UnivCnt(“PriceH * .10 > Price”) / UnivCnt(“1”))
Here’s the 3 series generator which I made public . Just enable the one you want.
And a shout out to Sentiment Trader’s tweet! Was retweeted 1000+ times. https://twitter.com/jasongoepfert/status/1520040516955643905
HI Marco
Thanks for the post. As a new learner I am trying every way I can to learn how to “program” p123.
Question in this formula
100 * (UnivCnt(“PriceH * .10 > Price”) / UnivCnt(“1”))
Why did you add > Price to the formula to the left of the / and to the right. Why did you add “1” to the formula.
It would be helpful if you all could make some videos or hold webinars on how to program in P123. That has the steepest learning curve for newbies and there is not much documentation on it, I have scoured the p123 site looking and can’t find the details I need to become proficient.
Thanks
Steve
Steve , inside the quotes is a boolean condition. Only stocks that pass that condition are used by the universe function which is this case is doing a count.
The first equation written a different way is perhaps clearer (by putting Price on the left):
UnivCnt ( “Price < PriceH * .10” )
This is counting how many stocks in the universe are trading below 10% of their PriceH, in other words they are down 90% or more from their 52 week high.
UnivCnt(“1”)
This simply counts the number of stocks in the universe since “1” is a TRUE condition so every stock passes
When you divide the 1st count by the 2nd count you get a ratio of how many stocks in the universe (in this case the NASDAQ) are down 90% from their 52 week high which is multiplied by 100 to get the %.
We have a tutorial about Aggregate Series in our step by step tutorials
Hope this helps
Marco,
Thank you for the explanation, very helpful.
Everyday I find code in posts that I am not familiar with nor can I find any documentation on it. Rather than remain in the dark, I am trying to ask for explanations, since I can’t seem to find documentation. Rather than hijack this thread I will ping you on another thread I started.
Thanks
Steve