While trying to replicate the CCC dividend payers (Champions, Challengers & Contenders) for REITS, I discovered that screening them for 3 year dividend growth decimated the published list. Checking REITs that did not pass my screen of the list showed some odd dividend data.
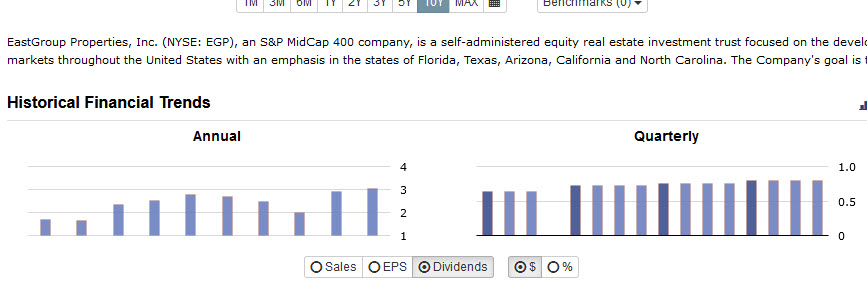
For example, EGP was on the published list but did not make it through my screen. Looking at the Div bar charts on the EGP snapshot showed that one quarter of data was missing in the quarterly data. But when I look at the dividend history in the price tab for EGP, the numbers don’t match the graph. There is no missing quarter of data in the dividends listed. The totals for 2018 also do not match the total on the graph (2.64 vs 2.00). Online at other sites the dividend bar charts reflect the dividends listed.
I found similar, but not necessarily identical issues with other REITs on my CCC list. CONE & DLR for example. Cone looks like it has an extra payout recently, but regular dividend payments prior to that. On the CONE bar chart there are no dividends for 2017 and 2018.
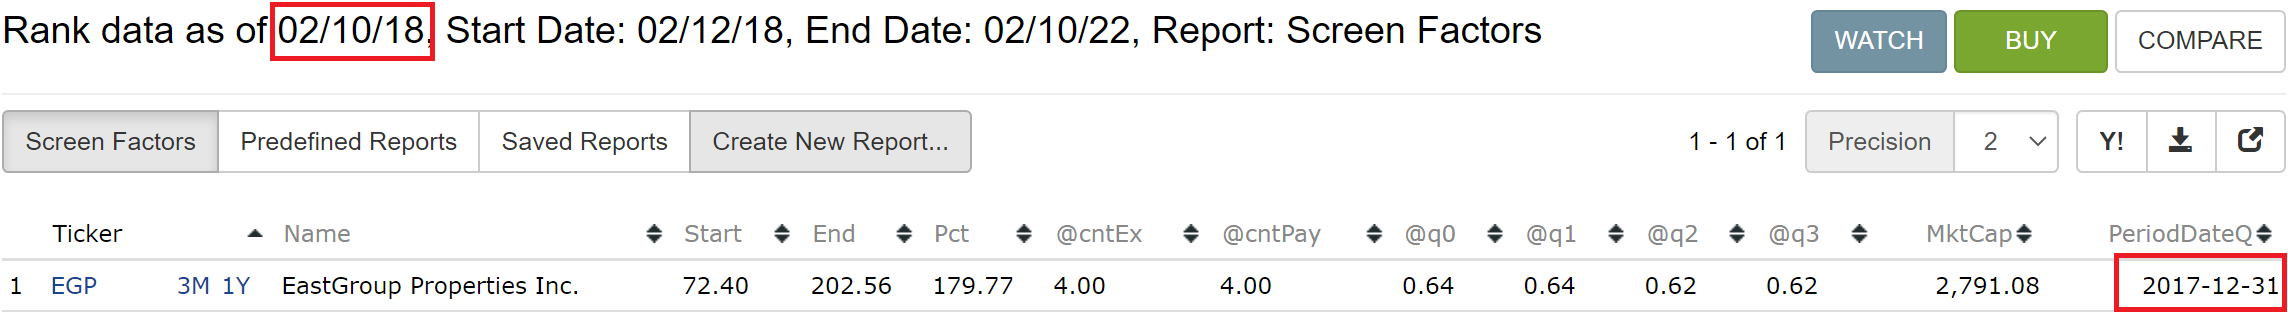
I checked the values for the annual dividends in the screen with SHOWVAL. They are the values shown in the bar charts, not the values from the dividends on the price page.
Any workaround you can provide would be very useful since I use DivPS(,) in several strategies.
Jim