How can you tell if an approach or a tilt index provides alpha?

I investigated the strategy underlying these two indices:

Fool-100 (https://www.solactive.com/indices/?index=DE000SL0EY00)

Founder-led BOSS-ETF (https://www.solactive.com/indices/?index=DE000SLA21M5)

Both outperform the market by a wide margin, but they are also cap-weighted. How is it possible to determine whether it is the Fool-100, or Founder-led companies, that drive the return, or if it is simply because a majority of the companies are large cap, and hence benefit from the broader momentum in the S & P500? ( Large Cap)?

Or how to determine how much of the return is attributable to alpha and how much is due to market and cap weighting?

You can create a equal weight index of the constituents on this site and compare it to those indexes.

Here is a start:
BOSS ETF
Fool-100

Both ETFs outperformed QQQ–BOSS by a lot, and Fool-100 by a little–and would have done a lot better had they used equal weightings.

However, I using most recent holdings of their respective ETFs so there is a strong risk of look ahead bias. Indeed, the most recent two years saw under-performance from both vs QQQ.

Is there a way to use historical holdings? I know that there was some talk about that.

[quote]
However, I am using most recent holdings of their respective ETFs so there is a strong risk of look ahead bias.
[/quote]Using the most recent holdings from an ETF for backtesting is a NO-NO. This will give survivorship biased returns.

For BOSS one can get historic holdings from 11/30/2019 (updated every 3 months) here:
https://whalewisdom.com/stock/boss

Georg, did you ever find an easy way to import historical holdings into this site?

Georg, as you know, your link provides names but not tickers. It is a lot of work to convert names to tickers. Did you find any shortcuts?

Furthermore, did you find an easier way to convert old tickers to the format used here with a ^nn in the ticker name?

There is no easy way to do this.
You have to upload the historic holdings with dates into a stock factor - cusip numbers work best.

That link used to have cusip numbers for the stocks. I have a query in as to why this has been removed.

Okay, here are some facts:

  1. Each ETF is required by US regulations to file quarterly holdings with the SEC. The SEC form is called NPORT-P. I assume that with a little more work I should be able to automate the process of downloading these forms.

  2. With a free (for now) account at https://docoh.com/fund/S000056121/global-x-founder-run-companies-etf/holdings-history, you can download all historical holdings for this (and other) ETFs which include tickers!

This link works better than mine. Remember the dates are actual filing dates. Point-in-time for us is 2 months later. So the list of 10/31/2021 would be PIT as of 12/31/2021.

Python code to create csv from docoh download (in clipboard):

import pandas as pd

df = pd.read_clipboard()
df.index = df['Ticker']
df : pd.DataFrame = df.drop('Ticker', axis=1)
txt = ''
for date, col in df.items():
    for ticker, amt in col.items():
        txt += f'\n{date}\t{ticker}\t{1 if isinstance(amt, str) else 0}'
txt = txt.strip()
print(txt)

Here is the performance of BOSS using historical ETF holdings:
https://www.portfolio123.com/port_summary.jsp?portid=1669252

Underperforming QQQ

NB: Some tickers were not available in docoh. Probably less than 5%.

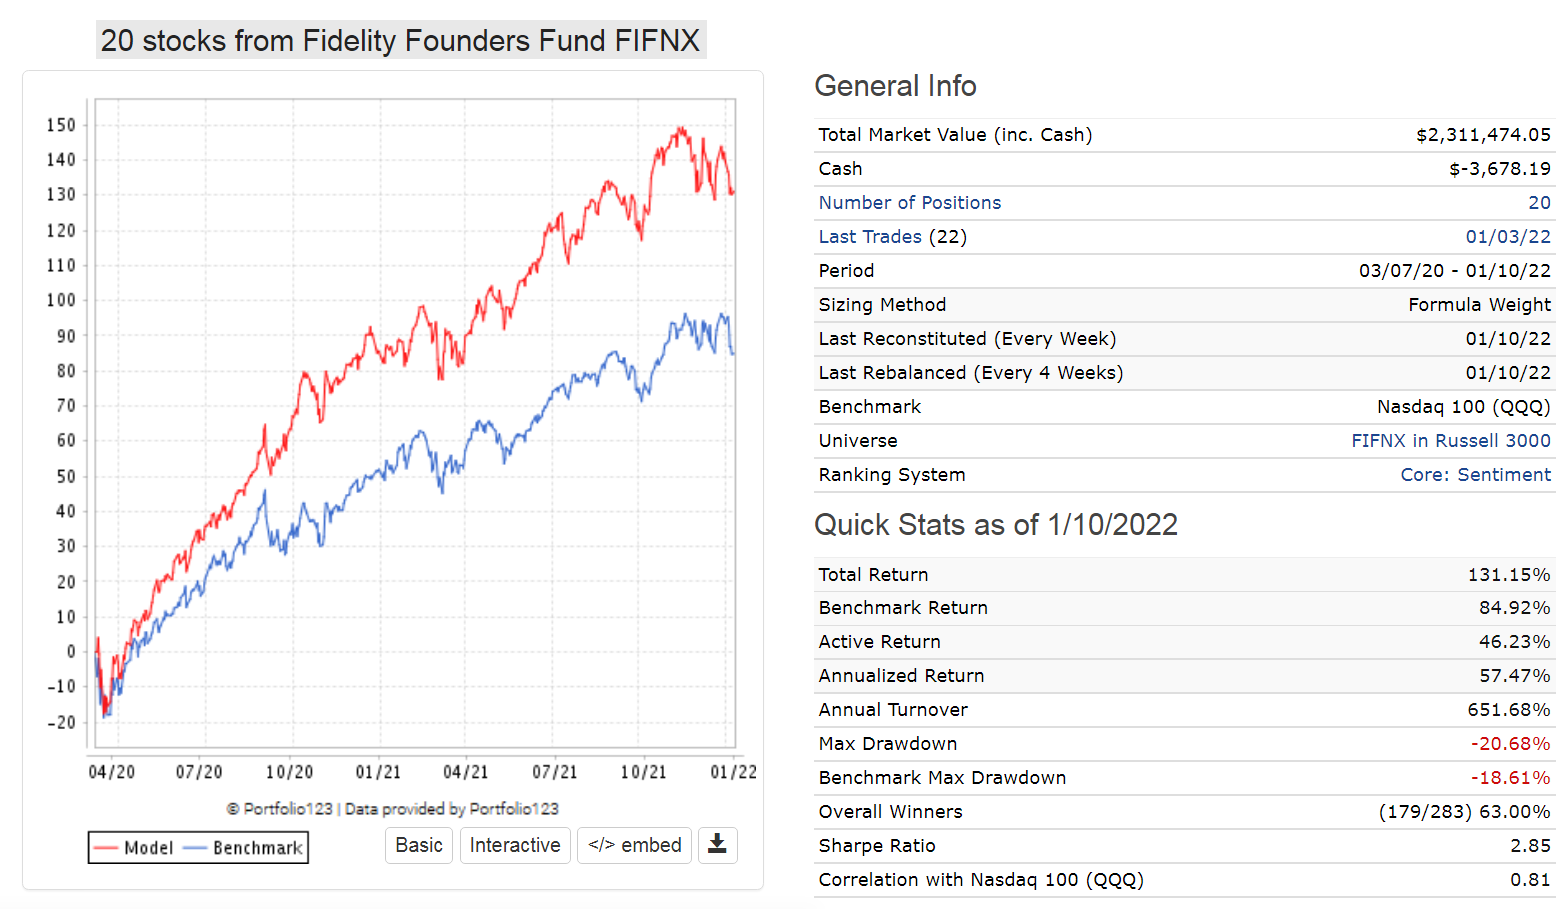
Here is the performance over the same period of 20 stocks from Fidelity Founders Fund FIFNX with P123 Core Sentiment ranking system.
Much better performance.


Here’s another fund that takes the same approach, but with a higher proportion of midcap stocks and 450 companies: https://docoh.com/fund/S000067868/frc-founders-index-fund / holdings-history

https://funddocs.filepoint.live/firstrepublic/foundersindex/

Azouz, nice work! Can you make your universe public?

Done. The universe is based on a custom stock factor.
Attached the file I used to import data for that stock factor.


StockFactor_ETF_BOSS.csv (24.7 KB)

Thanks!