Hey,
I got a book with a short and a long strategy.
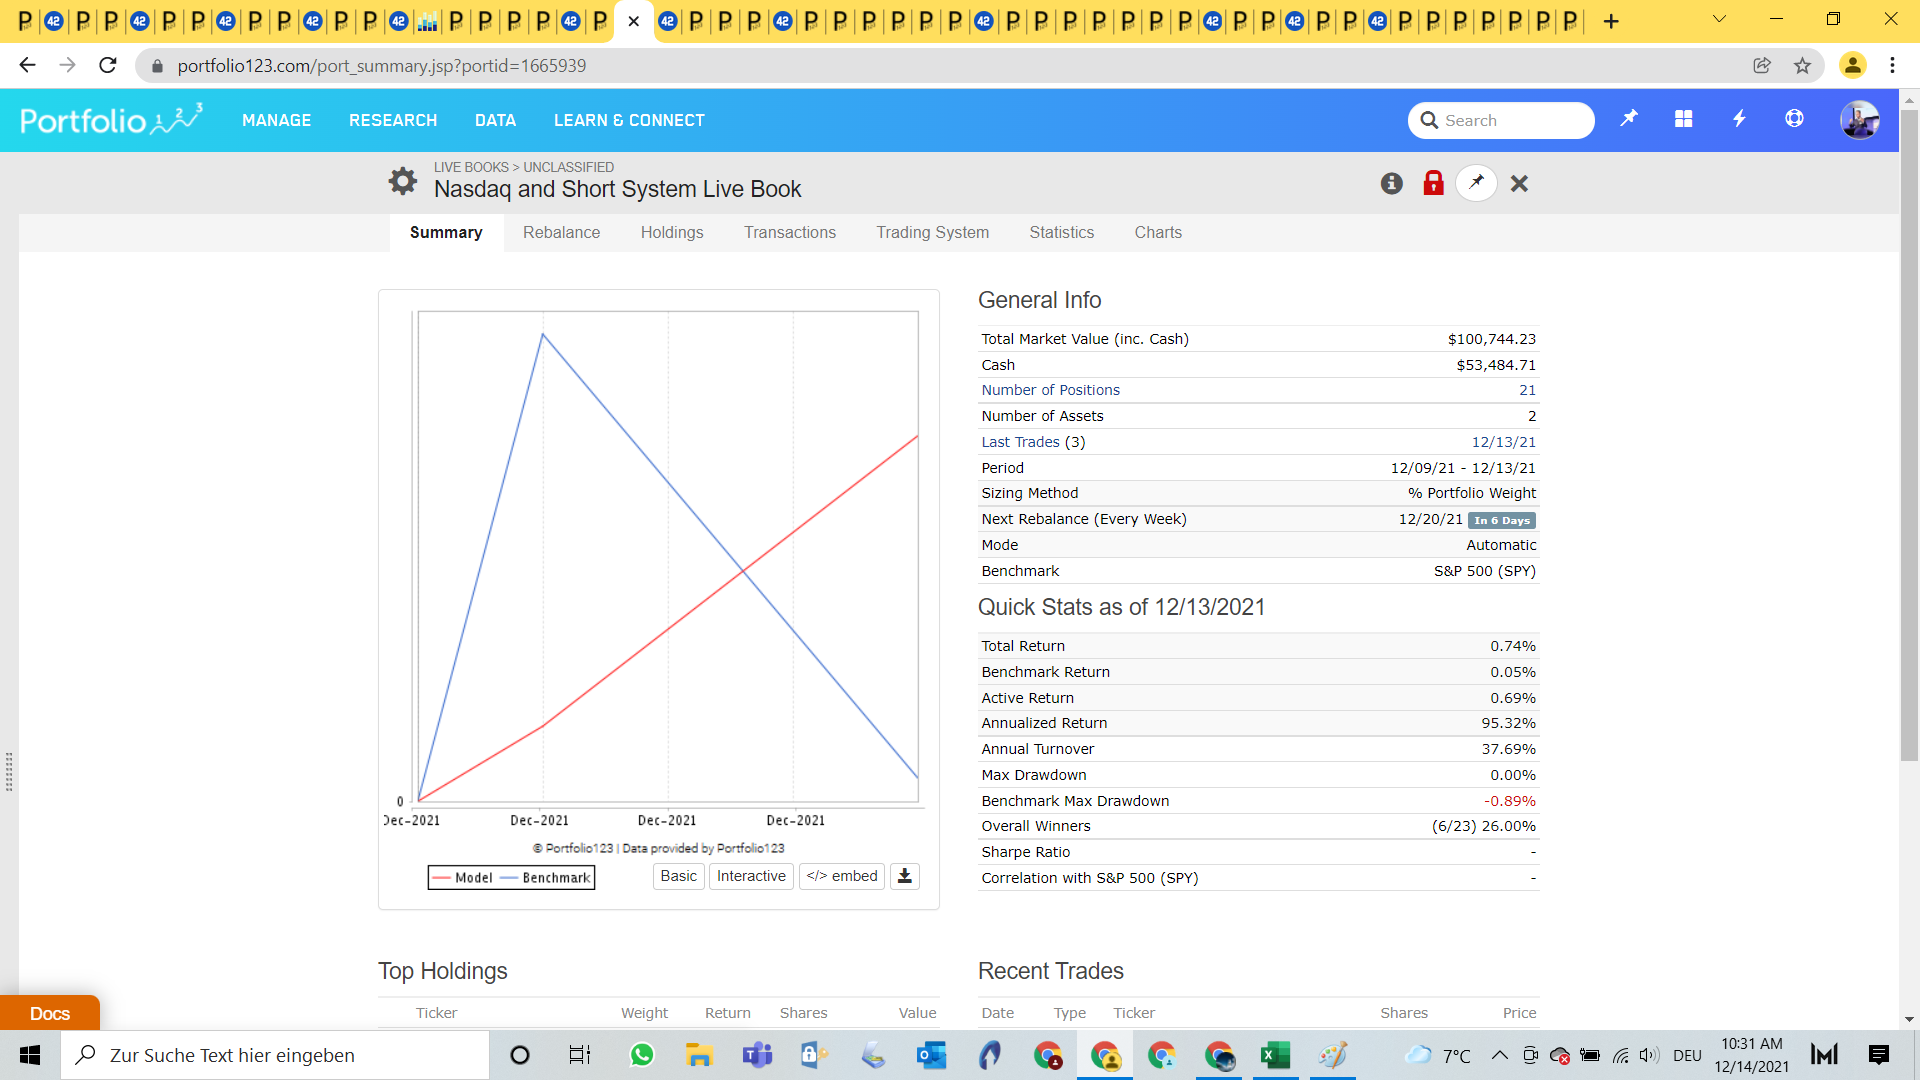
It looks like this:
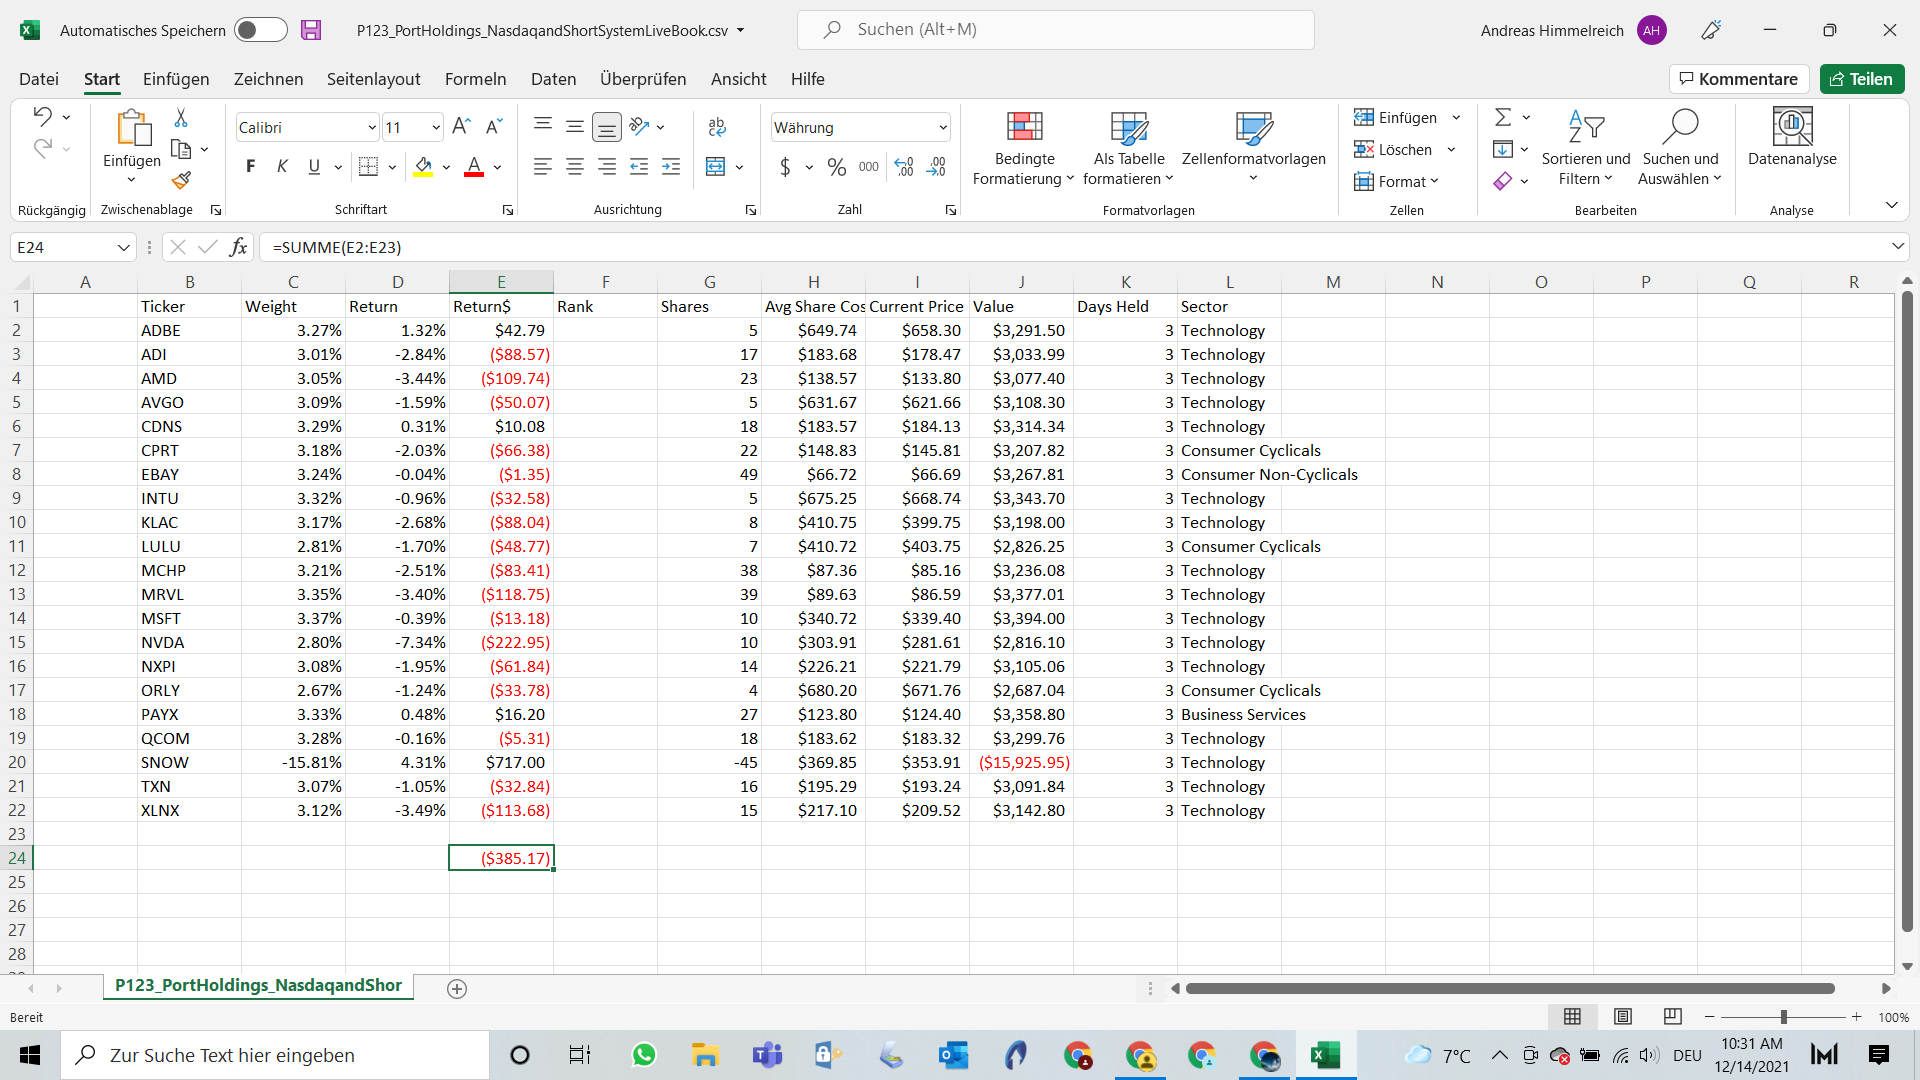
So the books cap curve shows that it had two up days, but my calculation (the data I got from the book via download, I converted the -717.00 to 717.00 to get the right result) shows that it had at least one down day.
Please help, thank you!
On December 10 you also had BABA and SE and more shares of SNOW in your short position, all of which you sold on December 13. The Excel sheet doesn’t include those positions. That’s why December 10 was an up day for you.
Understood, sorry!!!