fwiw, I use the “yield” version of the calcs - just makes more sense to me that way - just have to be sure to control for possible negatives in the denominator depending on what you may put in the denominator. My RD factor has about 13 variation inside. Might be overkill, but overkill seems to work for me on many factors. (can vary over time as well as vs universe, sector, industry sorts).
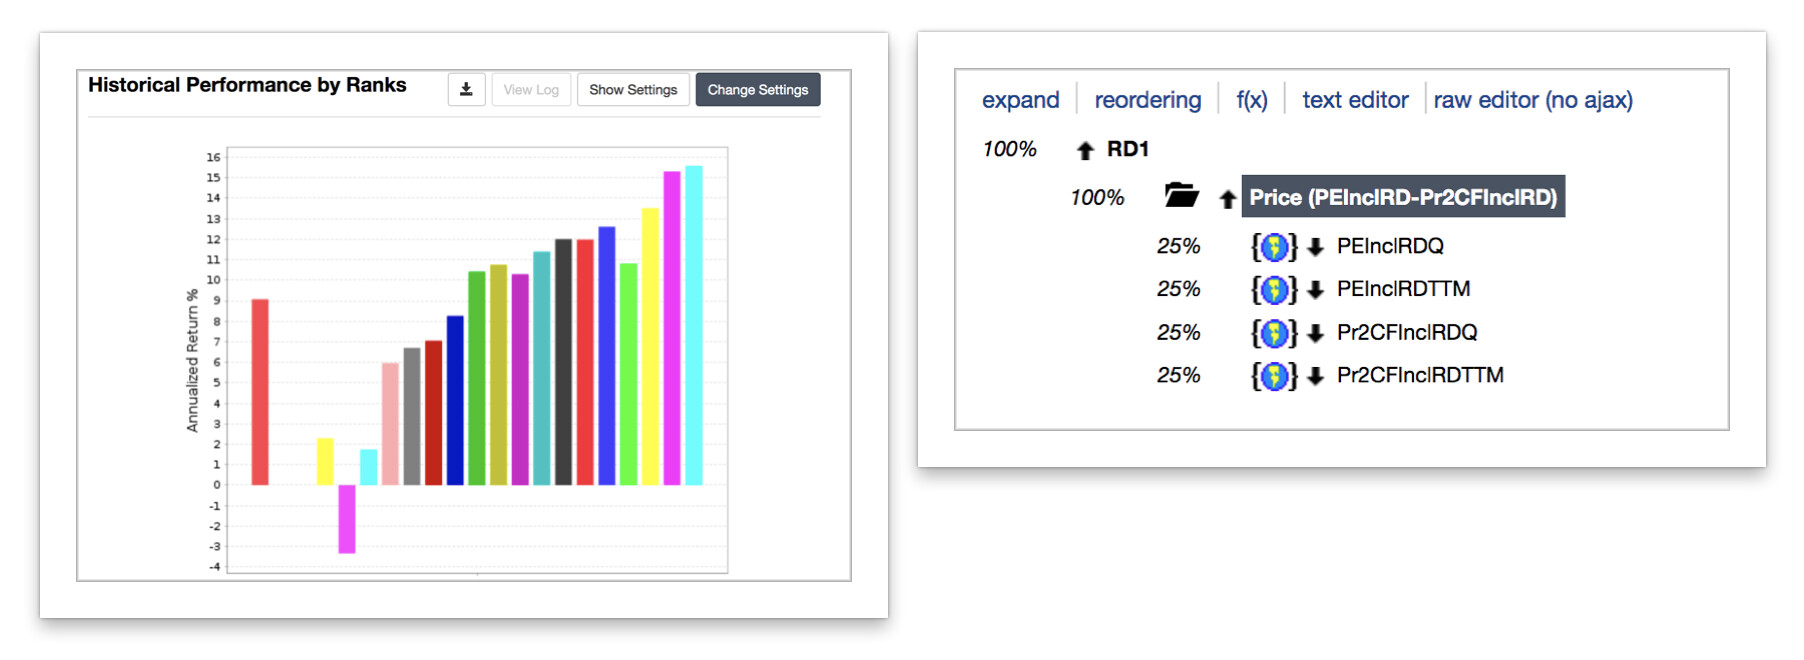
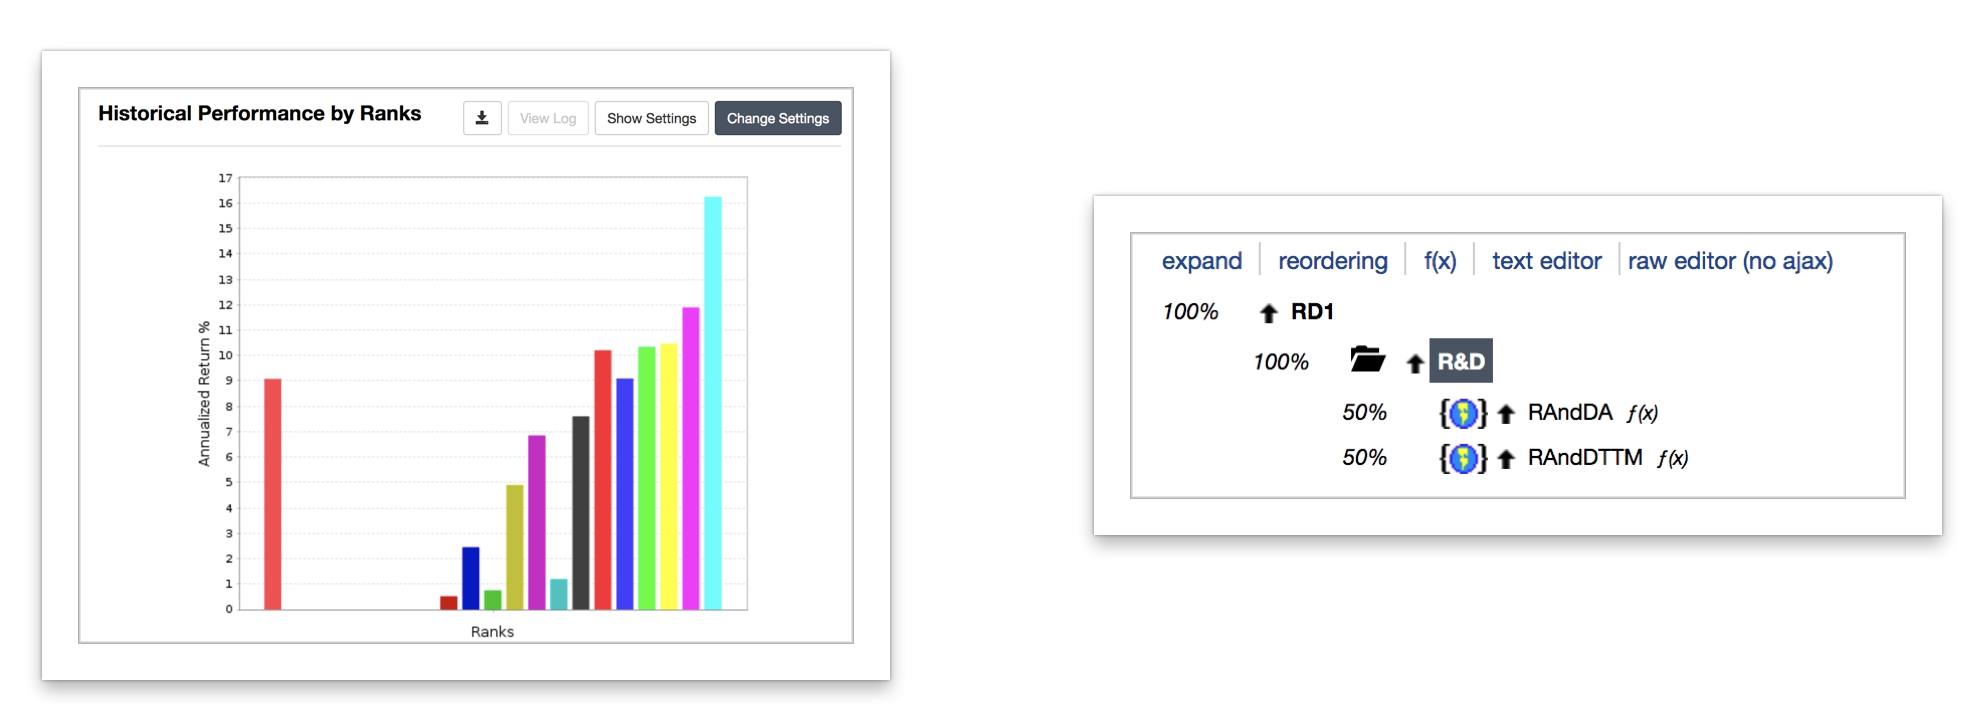
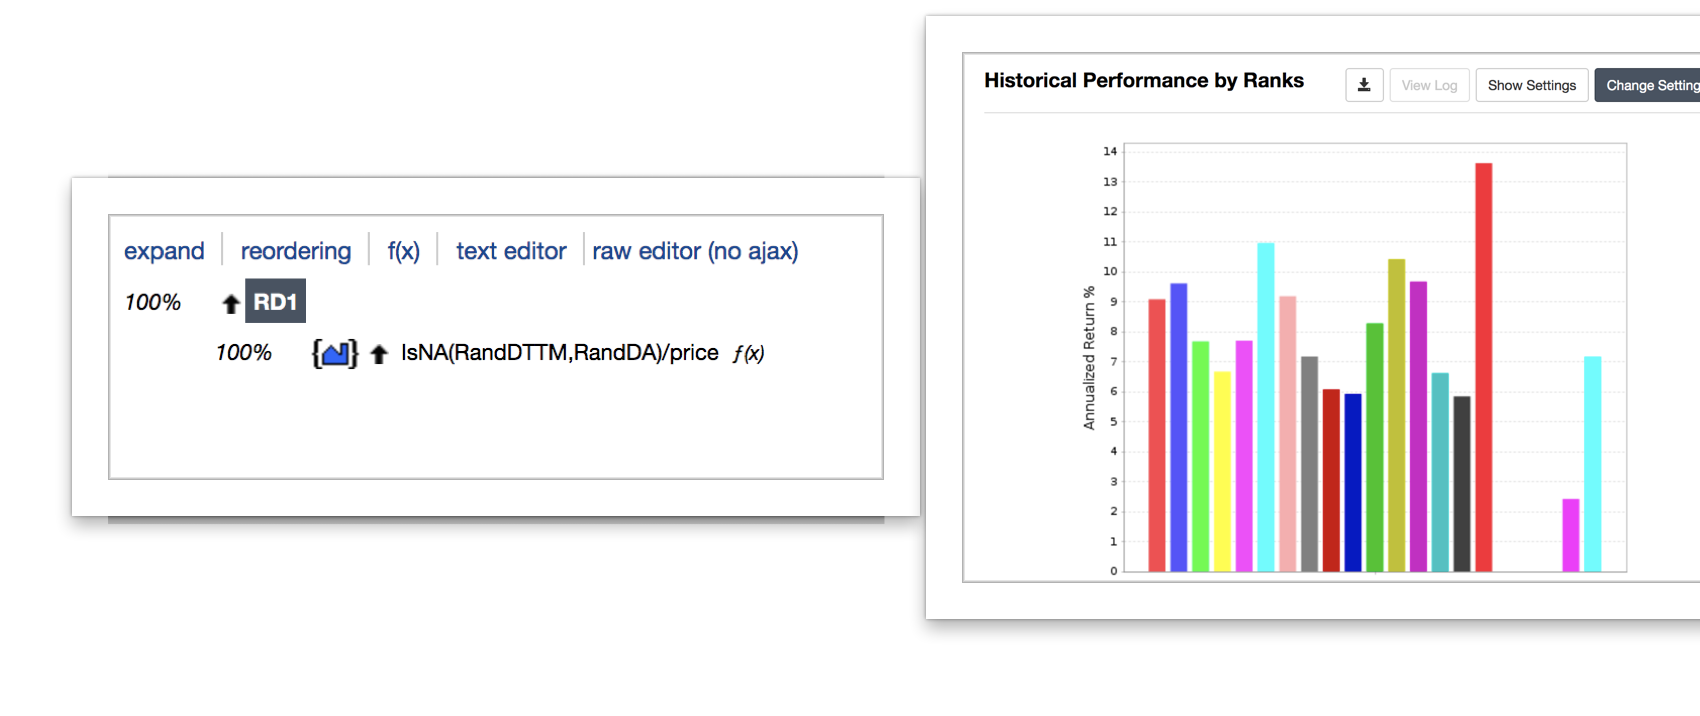
You have three very different things going on here. The first one uses price to earnings and price to free cash flow but includes R&D expenses in the earnings and free cash flow. The second one compares R&D to market cap to all stocks, so it’s going to heavily favor companies in certain sectors (healthcare and technology). The third one compares R&D to market cap to other stocks in the same sector, so it’s not going to favor stocks in certain sectors.
Also, the first one has comparatively few N/As, the second and third have a lot of N/As and treat them entirely differently. In the second, all the N/As will go at the bottom; in the third, N/As for sectors which have no R&D expenses at all (e.g. Financial) will get high ranks (since if 99% of stocks get N/A, they’ll all be ranked 98) and N/As for sectors with some R&D will go at the bottom. So the performance chart is going to be rather difficult to make any sense of.
I’m not sure why you used universe ranking for two of these and sector ranking for the third. If you’re going to use sector ranking, I suggest you exclude a bunch of sectors and subsectors from your universe before testing. This factor is mostly useful for healthcare and tech.
R&D should work only for high-tech industries, try to define your own universe of high-tech industries - this may be your secret sauce.
Then benchmark the strategy to your own universe.