I’m trying to find the stocks with new highs in the year. I use this rule:
Hi(0)>1.01*HighVal(#year,1,#high)
I placed it in a screener, and then order the stocks with the ranking system.
But the ranking seems not to affect the result of the backtest, since the backtest result do not change (and I amb doing it with different rankings), but the stocks in the screener does.
a ranking system works (and should do so) with all stocks of your universe, not with the selection of your last screening rule. If you want to rank only stocks with new highs, put this screening rule into your universe.
And, your screen is not visible for me, because he is private. You have to make him public, so that others can see him.
In order for your backtest results to change depending on how you rank stocks, you need to put a maximum number of stocks in the Settings tab. Otherwise, your stocks will be ranked differently but the same stocks will be bought and sold each rebalance period.
What you tried seems to work for me: Hi(0) = Highval(2500,0,#High). Alternately you could use Price = Highval(2500,0). The first gets you stocks that reached an all-time high yesterday. The second gets you stocks whose closing price is at an all-time high.
Is it possible to find stocks that are breaking their all-time highs?
Or stocks that have broken their all time highs yesterday?
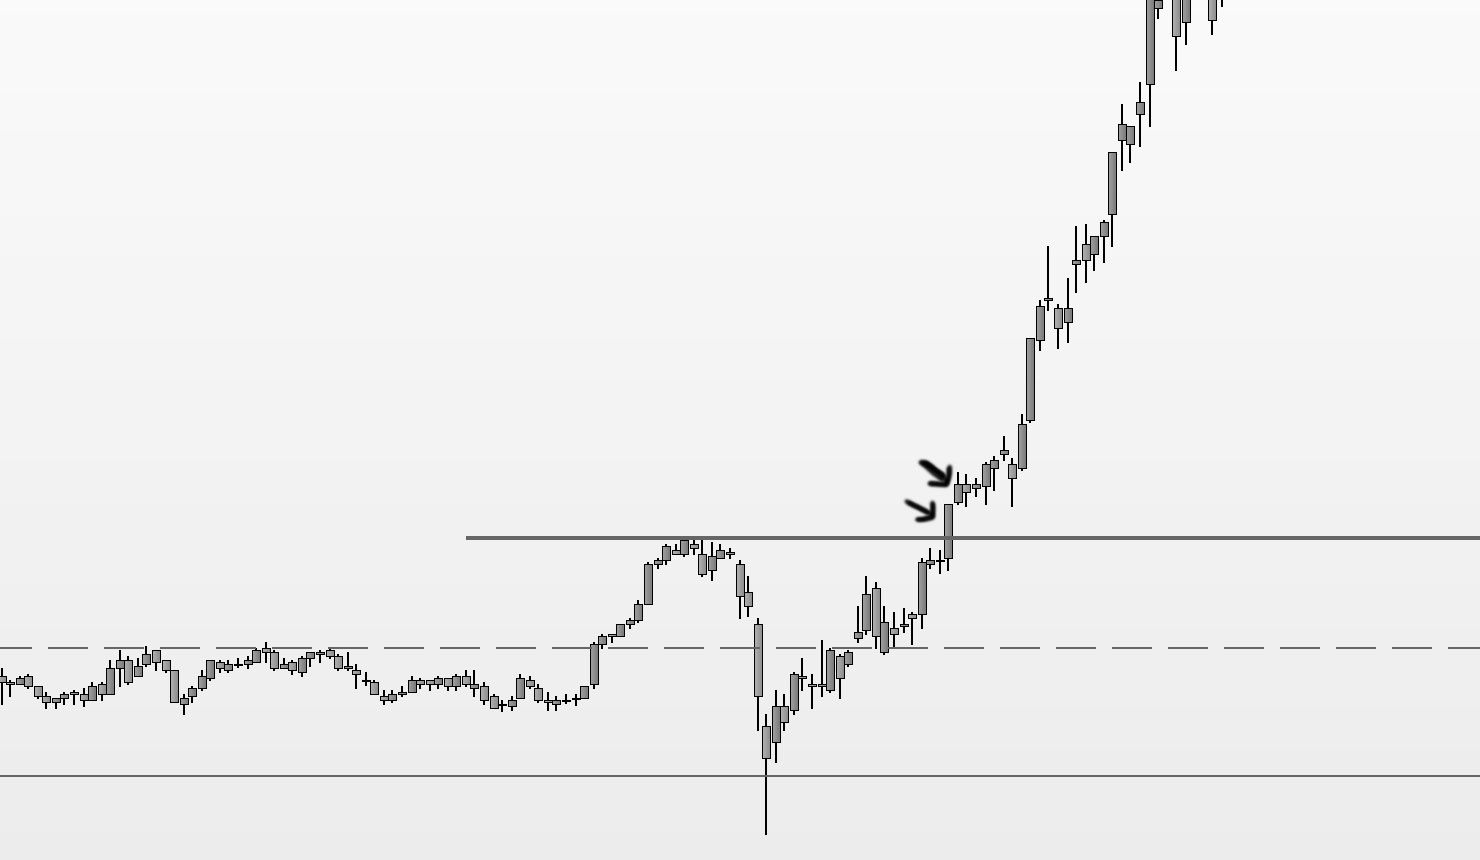
What I mean is, when a stock has a barrier, a roof, a “resistance”, and the price has hit it many times in the past, there is one day when the price breaks through.
Is it possible to find that kind of stocks the day after or the day it breaks?
Thanks!!!
I attach a picture of what I mean and what days I amb looking for.
I think that Hi(0) > Highval(2500,0,#High) should work.
It represents that the price has overpassed the all times high.
Indeed, in your image, the second arrow you mark, points at a candlestick whose new high is overpassing the new all times high formed in the previous candlestick.
For instance, if you place the formula you say in the screener, COF or DISCA, appear in the results, but all of them did not break any resistance, just break their previous “all time highs”.
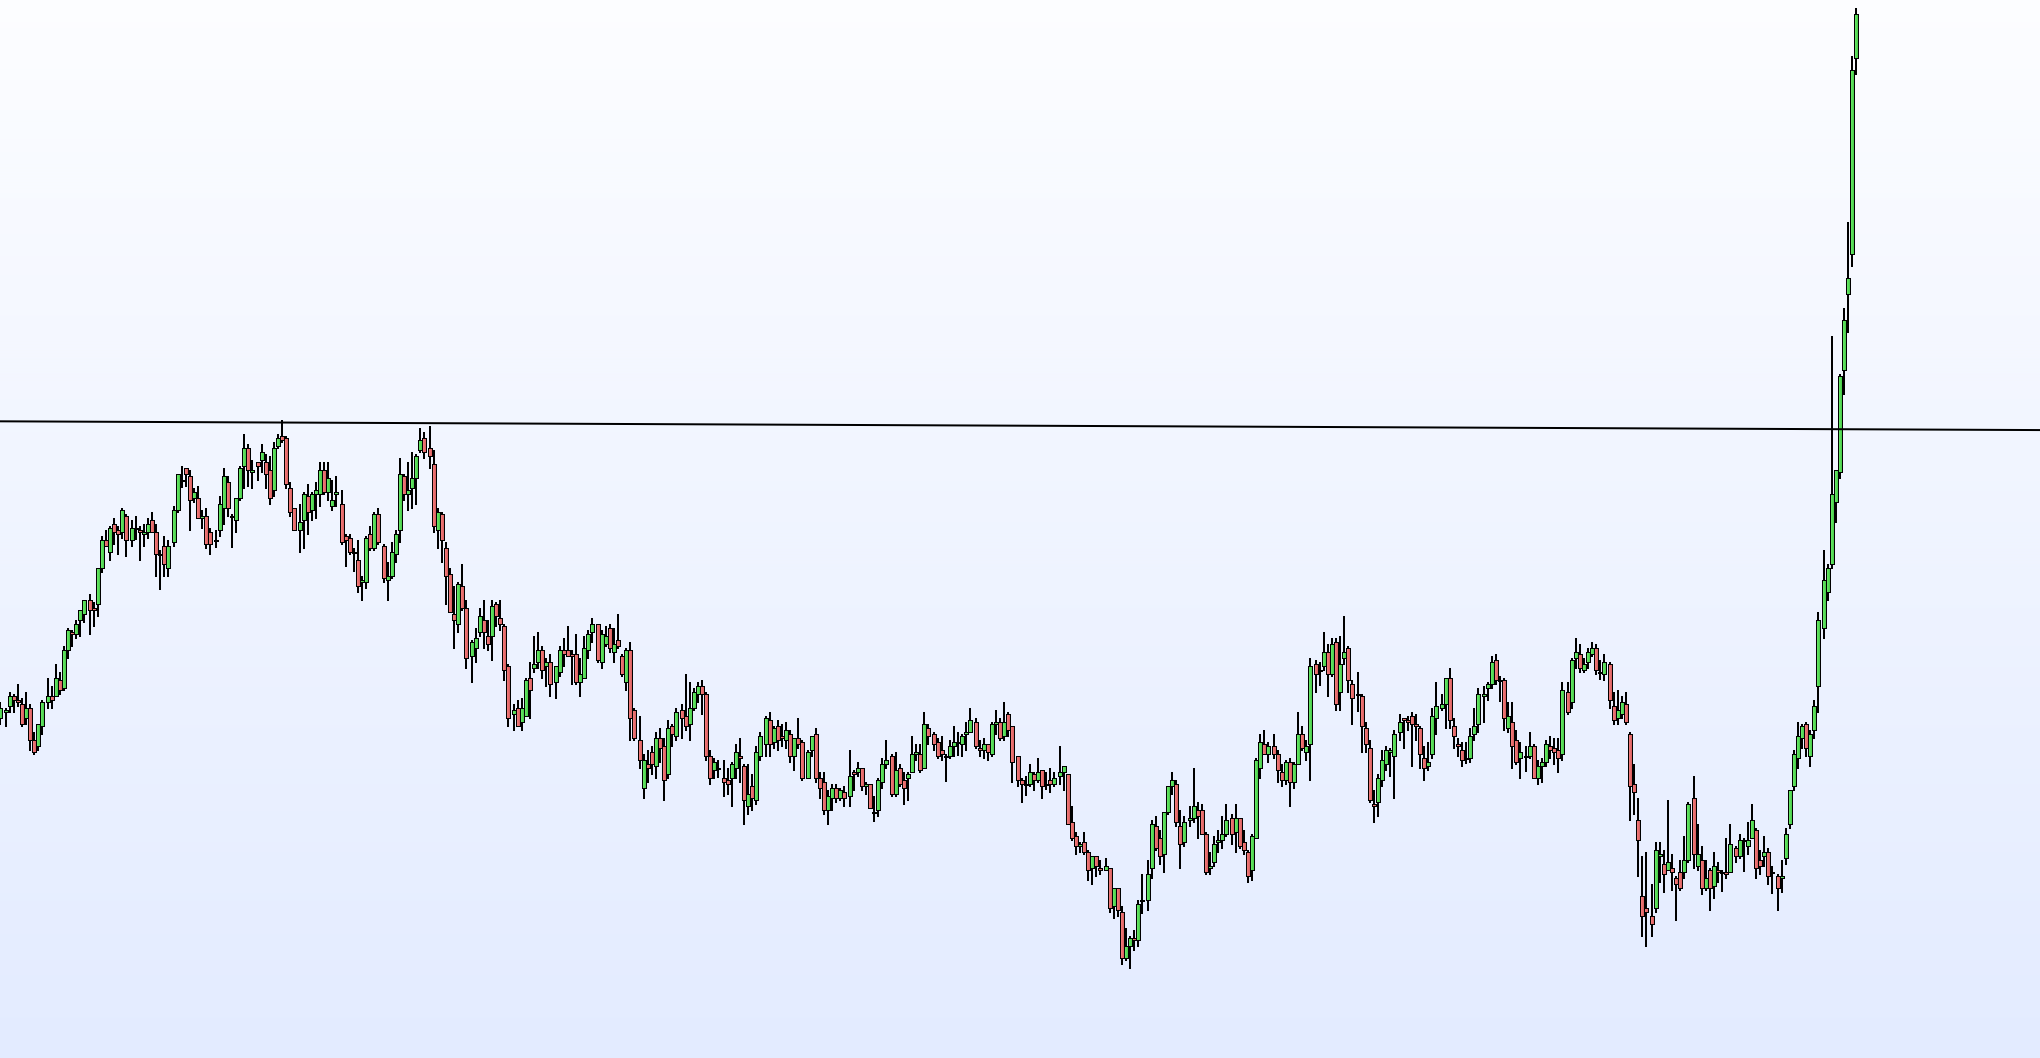
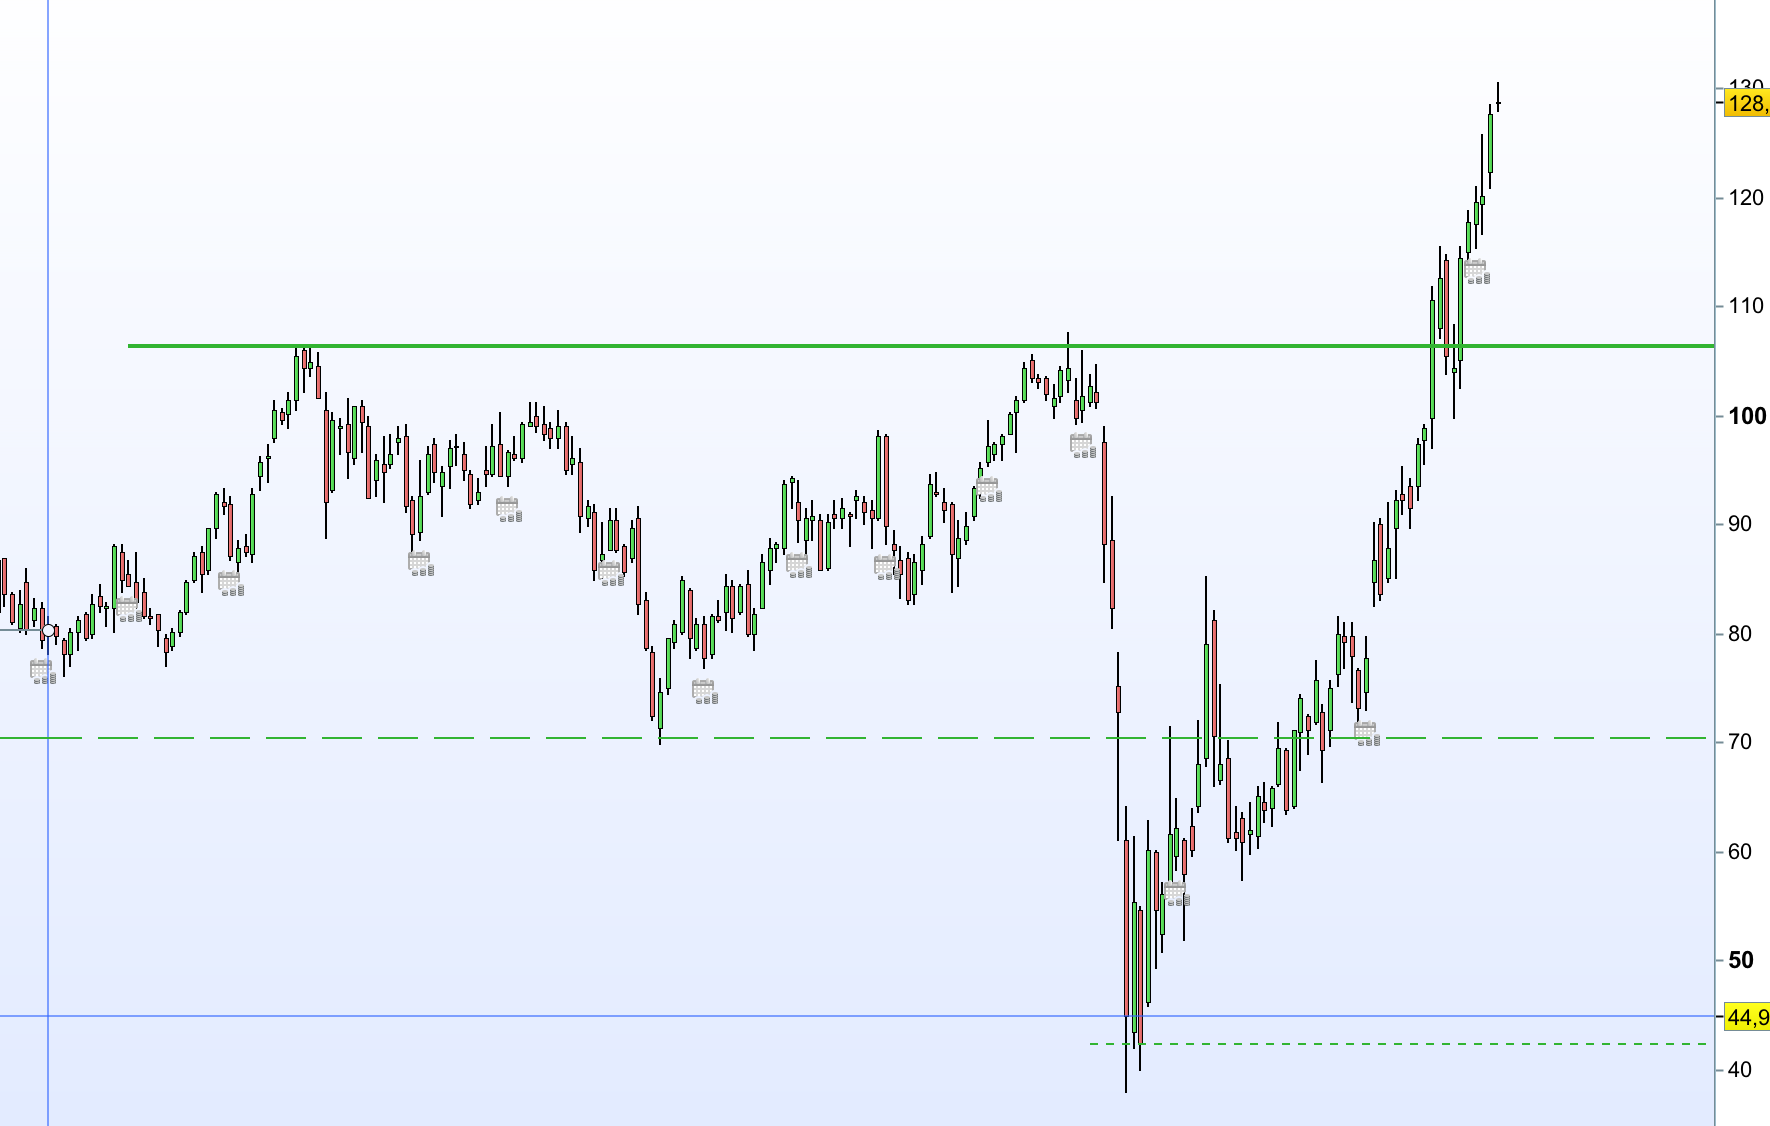
What I want are stocks that break a resistance yesterday, and now are in “all time highs” territory.
Of course, first of all, we need to define what a resistance is.
Maybe I can say a resistance is an area of the price where the price had hit a maximum level at least twice but it moves back.
But perhaps it is too subjective and dependent on the time setting of the chart. It’s not the same a weekly chart than a daily chart.
I attached pictures of COF and DISCA with their resistance.
I think you’ve identified that the problem is that what you are trying to do is so arbitrary. Technical analysis whereby you are looking for resistance and support is an exercise in pattern recognition, probably much better suited for AI or humans than a simple equation. The problem arises because this is a fundamentally mathematical platform. Can you rely on mathematical indicators like Bollinger bands, MACD, RSI, etc in conjunction with new highs? In the plots you mentioned an overbought RSI might be useful or a price hanging at the top of the Bollinger band.
If I understand your goals, this Screener setup may do;
ShowVar(@HighValBar,HighValBar(#Year,0))
@HighValBar=0 // current bar is high for the year
ShowVar(@Bars,LoopMin("Eval(Close(CTR)>Close(0)*0.97,CTR,NA)",#Year,1,1)) // look for more recent prior high within 97% of current new high, returns bar count or NA if target not found
@Bars>10 // select stocks where prior high was more than 10 bars ago. Change as needed.