When using the RS performance tool, why do I always get results like this, with some crazy outlier?
I assume these buckets are the stocks that fall within each percentile of the RS.
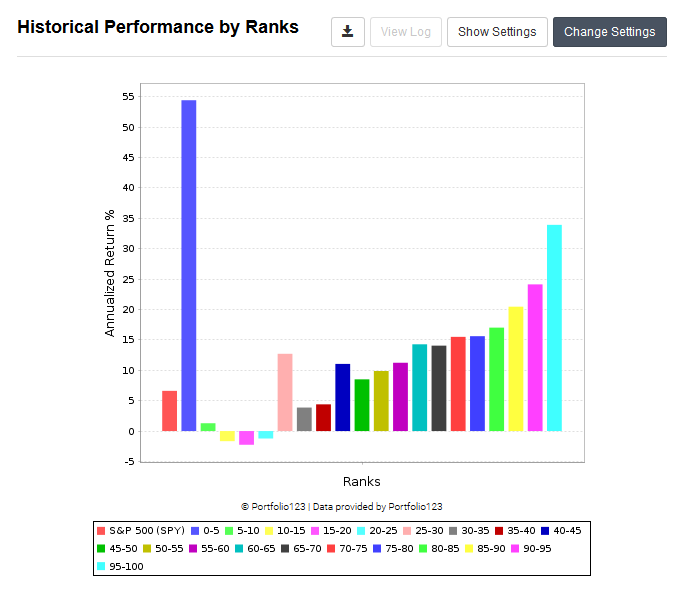
When using the RS performance tool, why do I always get results like this, with some crazy outlier?
I assume these buckets are the stocks that fall within each percentile of the RS.
Which universe?
I think this one is All Fundamentals.
Try to avoid All Fundamentals. It includes a whole lot of stocks selling for $0.01 or with almost no volume. Either use a universe you’ve written with some minimum liquidity rules or use the R3000 or the NOOTC universe.