I was wondering if anyone could explain how these ML tools can be intuitively understood by a human being when applied to factors, ranking systems, and/or equity curves. I have tried reading a number of explanations aimed at laypeople (non-programmers) but have failed to understand how decision trees can substitute for multiple regression. I know that they CAN, and I know that they produce better results than multiple regression analysis. I just want to understand the mechanism in an intuitive manner. For example, I can understand multiple linear regression by extrapolating linear regression into multiple dimensions. I understand correlation and probability and how regression analysis relies on them. But every explanation I find about decision trees seems Boolean and makes no reference to correlations or probability, and I can’t see how a Boolean process could apply to what we do here.
Let’s take a very simple problem. We have three factors and we want to weight them so that the combination will be optimally effective when applied to a certain group of stocks over a certain period of time. The multiple regression solution is to look at the results of each of the factors on its own and then weight them accordingly. Another solution (I don’t know what it’s called) is to try out about twenty different combinations, take the best one, and create variations of it, and so on, until a good fit is found. What’s the decision tree/bagging/boosting solution?
The problem you have is an optimization problem. It can be solved using genetic algorithms, pbil and other methods like the ones you highlighted.
Decision trees and other supervised machine learning algorithms try to solve other problems. You need inputs/features (example: ranks of different factors, for different stocks and for different dates) and one or several outputs/labels (return next month).
The model will get the inputs and will try to predict the output.
I know you understand this and have used bagging and bootstrapping yourself. Written on these topics elsewhere. Nice explanations BTW. As far as other ideas on how to explain this, I would start by what they are trying to accomplish. The why.
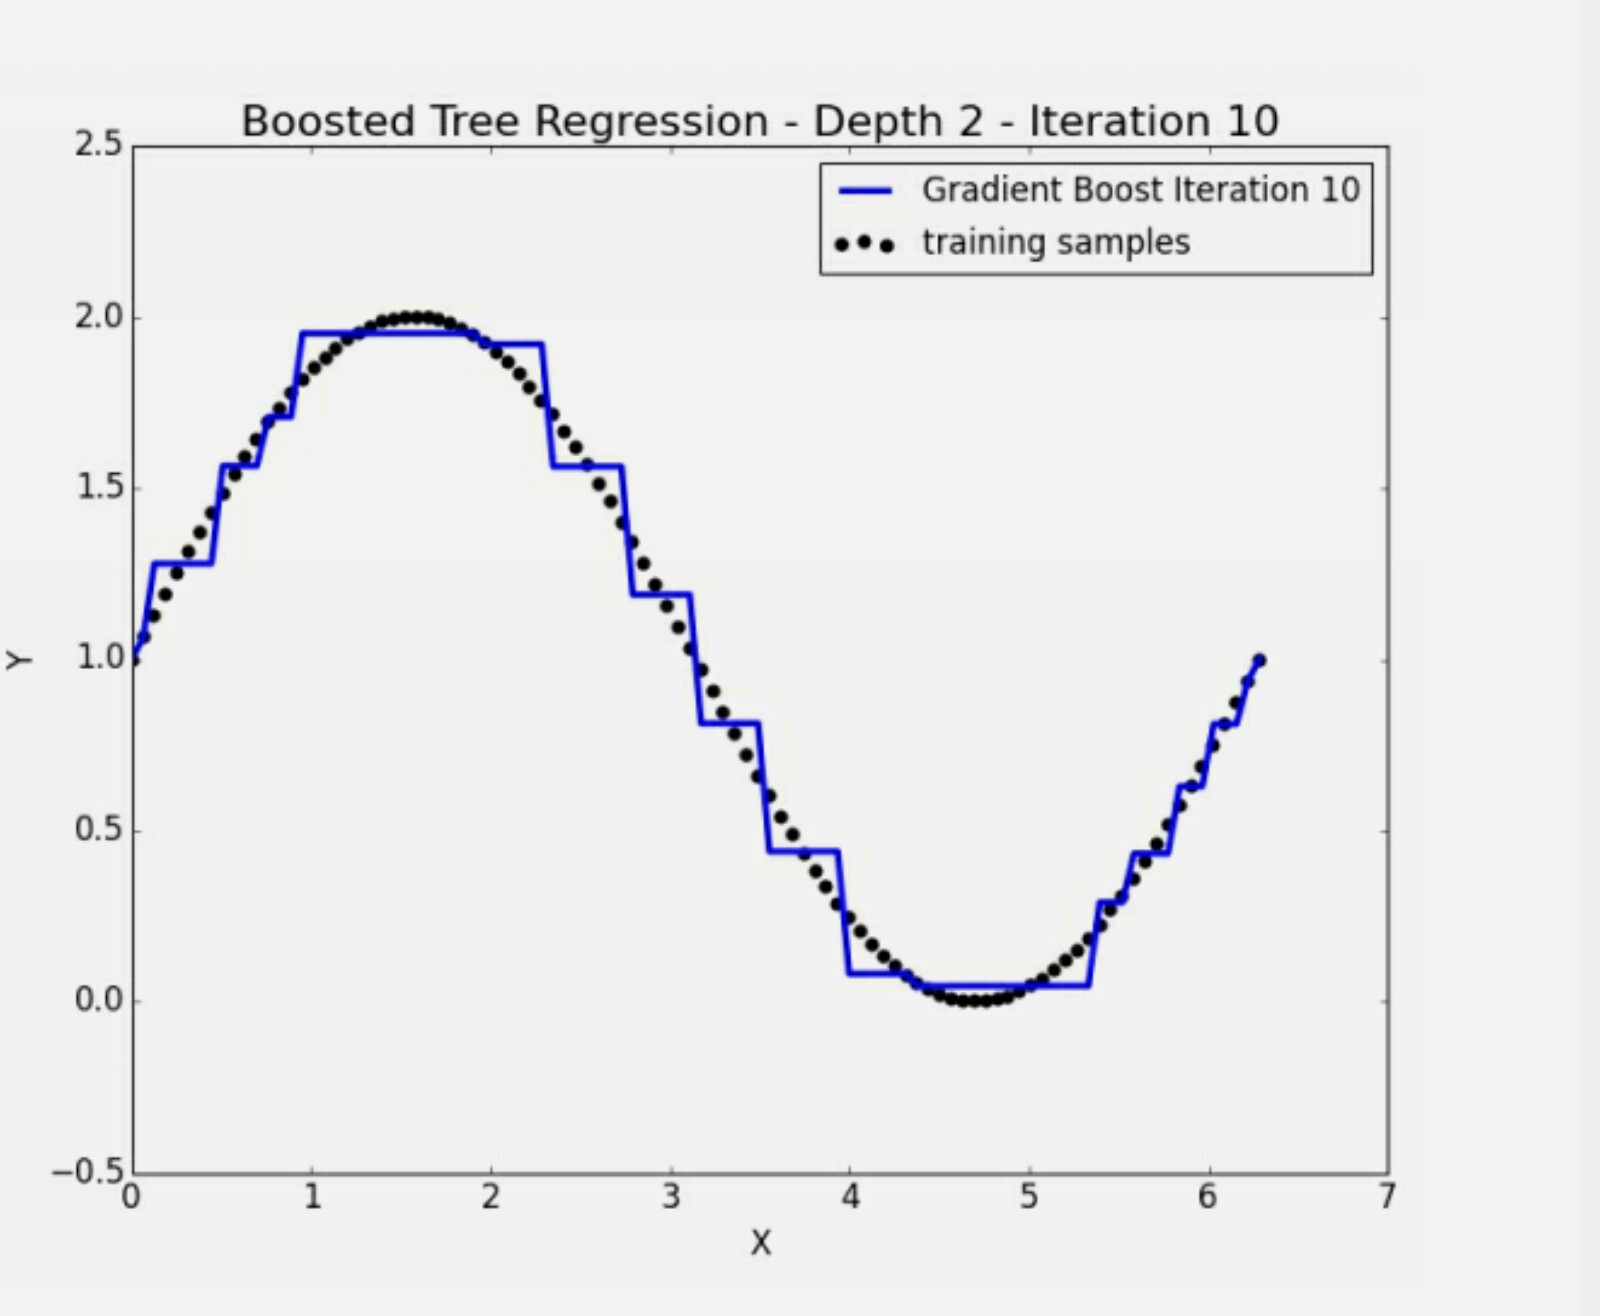
Here is an example from a book about how boosting can fit non-linear data: Image.
If you want to fit a line to the data do not worry about it just use multiple regression or the 2-dimensional equivalent here: linear regression. If you want a little better fit use boosting. In this example, at 10 iterations the boosting model (blue) is fitting the data pretty well already. To my eye, a little better than a line would. But that could be just me.
That is the why. Or more technically: Not all curves are a line.
For the how I would recommend an easy book for $2.99. This book truly has all the theory one needs to understand this. Not easy enough to fit into one post however. Too many pictures in the book for one post: Machine Learning With Boosting: A Beginner’s Guide
Ah, now I see. Thank you! Do these three machine learning algorithms use the mathematics of probability in any way? In my reading about them, I haven’t found any evidence that they do.
I have definitely used bootstrapping but I don’t remember ever understanding what bagging is. On the other hand, my memory is terrible, so if I did, I apologize.
This looks like a terrific book. I’ve purchased it and will read it soon. Thanks a million!
Thank you. Everything is alright. Hope things are going well for you as well.
I started working again with ML the last three or four months. Still doing a lot of experiments but seems promising when using the right features.
Feature engineering is certainly one of the most important aspects to come up with a good model.
I do not want hit you with too much at once. But as you look at this you may encounter mean-squared-error (mse) or root-mean-squared-error (rmse).
Just be aware that every time they use those metrics that you can also use mean-absolute-error (mae) or even other metrics of your choosing. It is trivial to change the metric with XGBoost (and other ML programs).
As I recall, at one time you were not a fan of rmse and preferred mae. As do I—especially when there are outliers.
Don’t spend too much time worry about which metric is used in the examples is my only suggestion. You can always change it.
Thanks. These articles do help me understand to some degree. I’m still puzzled as to how decision trees can be used with P123 data, though. I can definitely see how ensemble methods can (and I use those myself, clumsily). Maybe I’ll get it after I read the the Machine Learning with Boosting e-book.
One thing I know for sure it that you should stick with your present method that you are now using for your investing.
Personally, I think it is good that your are looking at boosting to see if it does (or does not) have a place in your investing. But you certainly have no pressing need to make any changes now that I see.
The book will NOT give you an answer as to whether to add some boosting to you investing, I think.
I think, in addition to looking at the book, listening to what Azooz has to say as well as using other resources you need to focus whether non-linear is better than linear. That is what will tell you what methods to use, I think
Use more basic models to understand this. Is linear regression or polynomial regression (with its curved line) better for non-linear financial data?
Make up some contrived financial data that is clearly nonlinear. Do you want a curved-line fitting that data or a straight line. What 2-dimensional model is best for that? Is Theil-Sen estimator a better estimator? Is that the best? Something better still?
Theil-sen estimator is better for many things because it uses a different metric than standard linear regression but is it still linear, I think. Could you do better still if there were something that uses the Theil-Sen estimator metric but is non-linear?
If the answer to this last question is yes then boosting could give a similar non-linear result with a Theil-Sen-like metric.
Anyway, stick with 2-dimensional examples to sort this out is what I would recommend. Read the book but focus later on how boosting gets its non-linear solution.
Figure out how P123 is really picking stocks. Is that linear or mostly linear? Are the weights of the factors constant? Does that make it linear? If not linear then what curve is it? Would a non-linear P123 classic solution be better still?
Anyway, the only thing I know for sure is that you should continue to use your present system and make any changes gradually.
Maybe focus on the why to use non-linear methods (or not) if you want to know what models to use.
And for sure keep talking to Azooz. He knows what he is talking about.
And he can give you, P123 or anyone else a computer solution to any machine-learning problem in any computer language you could imagine. Want it in C++: no problem. Want it this afternoon: no problem. Any other computer solutions you want by this afternoon since you have such an easy request for me?
Also notice what Azooz is doing is not a cookbook solution. If I understand correctly, he is having to look closely at what factors to use and the best methods of selecting them. He can expand on this further if he wants and I might not have understood his post fully. But perhaps even he does not have a cookbook solution.
Anyway, use him as a resource. Email him if you haven’t already.
And he could do some programming for P123 on machine learning if there is ever a need.
P123 classic is a powerful tool and no one has to use machine-learning to make money here. Furthermore, Marco is working to expand the tools available through the API for whatever methods people want to employ including (but not limited to) machine-learning.
So I am not trying to convince anyone to use machine learning. That having been said I have benefitted tremendously from discussing machine learning with Steve Auger, Azooz, you and an others on this forum.
I also know that you have been a fan of de Prado in the past. He has this to say about multiple regression (and linear regression):
“If the statistical toolbox used to model these observations is linear regression, the researcher will fail to recognize the complexity of the data, and the theories will be awfully simplistic, [color=firebrick]useless[/color]. I have no doubt in my mind, econometrics is a primary reason economics and finance have not experienced meaningful progress over the past decades.”
Okay, that is a bit too strong.
From time to time I review linear regression. I forget the equations. Lose sight of how closely correlation is tied to the slope of the regression line. How important Z-score is to linear regression. Lose sight of how the line is related to the data. Honestly, if one fully understands that then I think the rest is just an extrapolation.
Boosting is just linear regression with a curved line and an extra dimension or two. Ultimately the equations are equivalent if you use root-mean-squared-error as your boosting metric.
Okay, that’s not right. Boosting is linear regression without any of the limiting assumption—like homoscedasticity, normality [color=firebrick]and importantly of linearity. But that is all theory one needs to understand.[/color]
Ultimately however, if one is interested in the equations they are equivalent to the equations for linear regression and with the same purpose. I think authors go out of the way to make this difficult so they can look super-smart. That having been said, Steve Auger and Azooz really are super-smart and do not have to go out of the way to make it seem difficult.
Me, I just try to fully understand linear regression and imagine how those equations can be used on a curved line. Copy a little Python code from the internet. Reuse it for my next project. Anyone can do it if they have an interest.
And maybe–with a little persistence–I will have data to see how close de Prado is to the truth.
Thanks, Jim, that makes a lot of sense to me. It’s a nice explanation indeed.
I was doing some non-linear regression yesterday regarding the relationship between portfolio size and buy and sell position ranks (i.e. to get a portfolio of 40 stocks with a buy rule of rankpos <= 10 what does the corresponding sell rule (rankpos > X) have to be?). I found a power equation that came pretty close, but the best thing was just grabbing a bunch of data points and making educated guesses as to the in-between values. I suppose that’s somewhat comparable to what the decision-tree ML algorithms are doing.