Assuming you do not think this is a closed issue and that you have not already seen all the data you need to see, I think I have some data to share.
I seem to have forgotten my auto ports. Sorry I did not think of them till now.
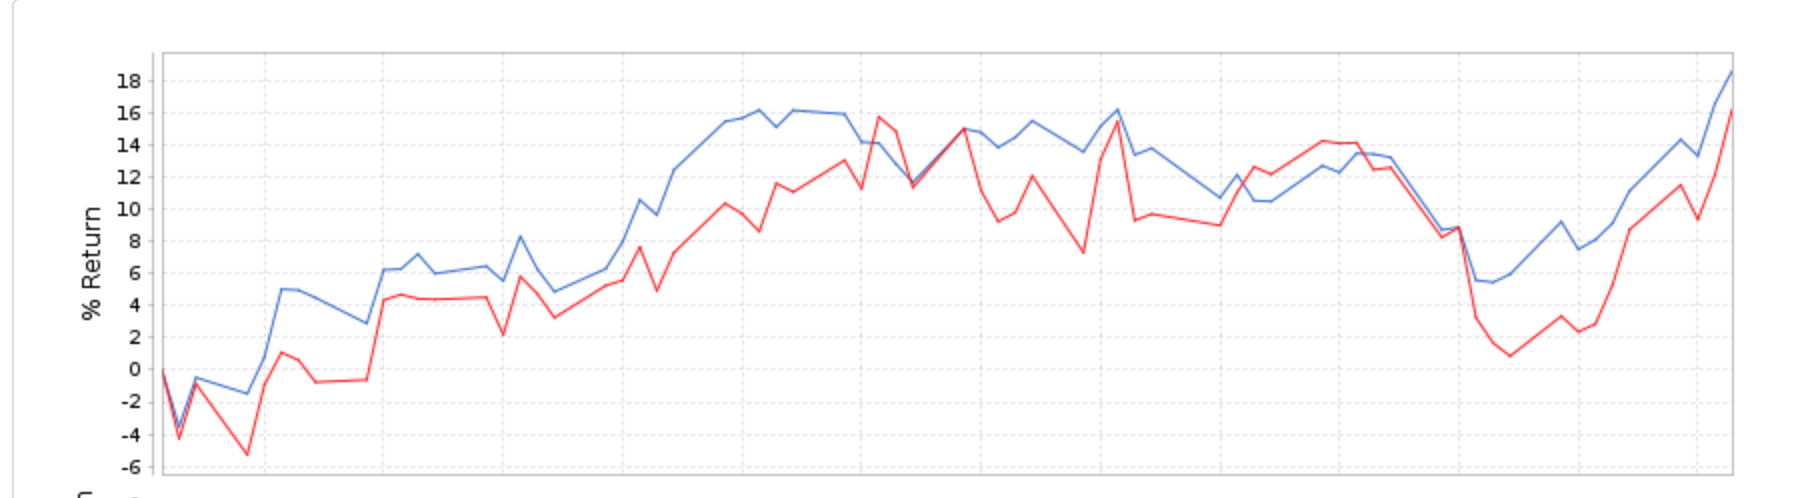
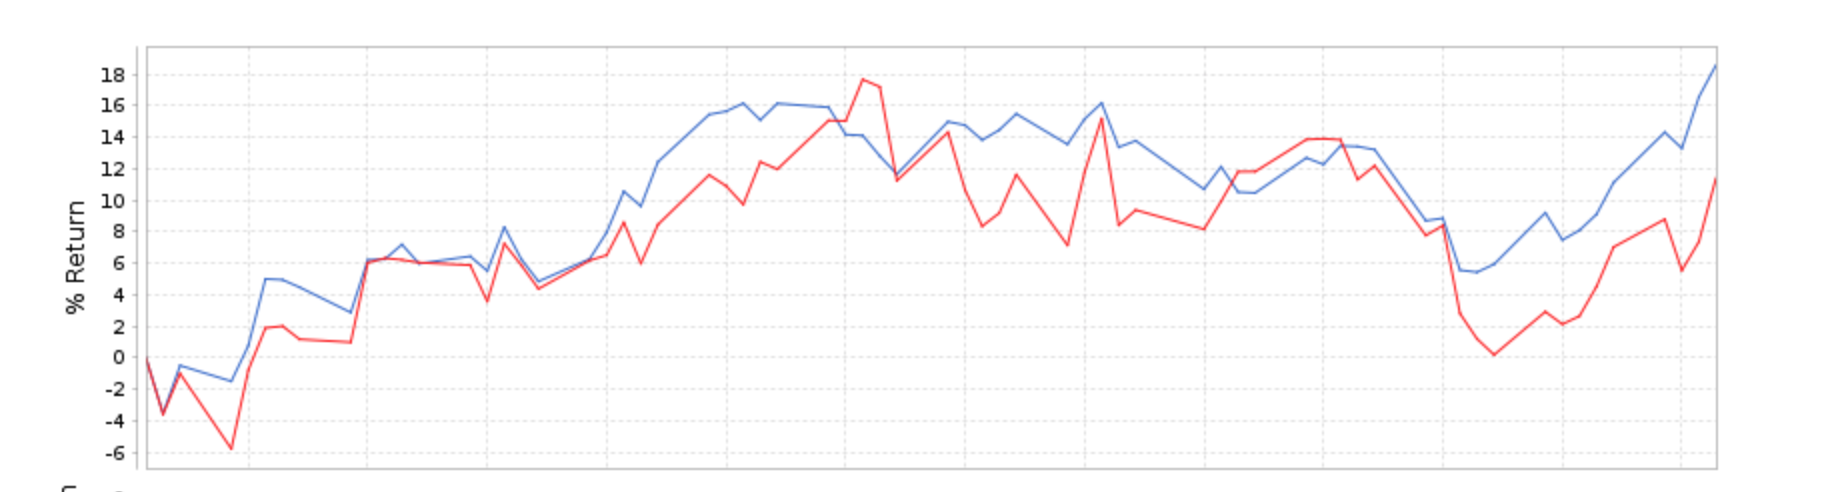
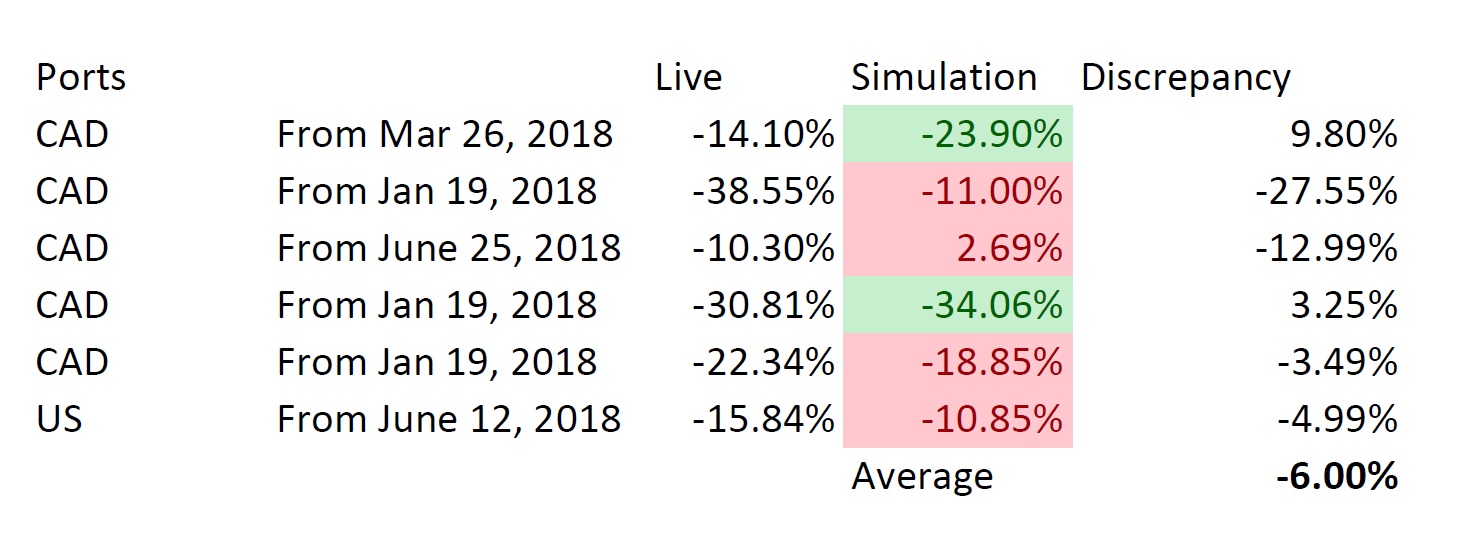
Here is the very first (non-cherry picked) port and sim. I have not looked at any others yet, I ran the sims with both preliminary data and exclude preliminary data. No revisions or discretionary behavior that I forgot about on these auto ports for sure.
The port is an auto port started years ago. It looks like it defaulted to Use Preliminary Data. The sims were set to Next Average of Hi and Low and Variable Slippage before running.
These are all over the same 3 month period since we switched to FactSet. Roughly a difference of 4% over a 3 month period. This was a 10 stock model.
I looked at 30 ports that are on automatic. Almost all of the ports were started in 2015 (a couple were started later). There are no discretionary trades or revisions to these ports.
I converted every one of the ports to a sim as Nisser suggested in his post and compared the returns. There is no selection bias or removal of outliers. All of the ports were used in this study.
On average the sims performed better than the ports. The mean difference in annualized returns of the sims versus the ports was 8.6% in favor of the sims.
P123 says there is some look-ahead bias. My study supports this conclusion and puts a ballpark magnitude on this effect. People’s anecdotal findings are not far from the 8.6% lending additional support to this study.
This number may serve as a ballpark estimate of the magnitude of the effect until someone does a larger study. People can–on their own–make an assessment as to how important this is to their own investing.
Going forward, comparing the sims and ports will likely have different results because P123 has been Snapshotting some of the data for the last 6 months.
Thank you Nisser, Brett, Chaim and RT for making me aware that the effect of look-ahead bias is not trivial at P123. Again, people can make their own assessment as to how important this is to their investing. Please email me if you want further details of my study or if you want me to send you a copy of the spreadsheet I used.
What price were you using after you converted your live strategies to simulations? Previous close, next average of high and low, open, or next close? The default is previous close. If you didn’t change that, that could easily account for a great deal of the 8.6% difference. In order to properly compare a live strategy to a simulation, you need to run it using the average of high and low and next close and take the average of those. Probably using just one of those is good enough. I’m also curious what the median difference is and how many live strategies out of the thirty you tested gave superior returns to the simulations.
These are good questions. I get tired of the motivated reasoning on this site. Sometimes I turn into CNN and FOX news to get some relief.
But these are good questions.
I also hope that you appreciate that these are just my findings with little comment or discussion. Maybe not a lot of motivated reasoning from me (today at least). I do have some questions still as you may notice. I do not mean to imply that my little study is the final word.
I would have been happiest to find no difference. People can decide on their own how big of a difference this is. Maybe look at their own ports that have no revisions or discretionary trades.
Correct. Previous close is the default. Is there a reason for that? If not, I wonder if that might not be worth changing. And obviously that would be a big problem for anyone not noticing. Should I make a feature request?
This is a concern indeed, and I was already aware of it.
That was the first thing I changed after converting the port to a sim. I switch the price to “Next Average of Hi and Low” and then I checked that the slippage was set to variable. As you know that is the default and I did not change the slippage for the sim.
I though so too.
So again, excellent questions and much appreciated. Let me attach a copy of my results and you can enter the data into a spreadsheet and manipulate it if you want (getting MAD etc if you wish).
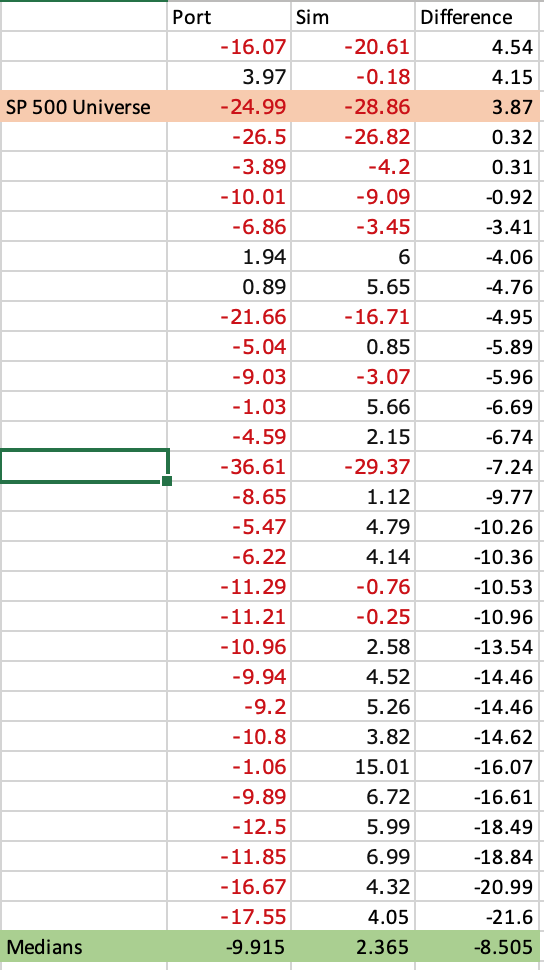
But in a word the median was: 8.5% (in favor of the sims).
Let me make a few simple numerical comments. Something like a t-test is not appropriate here. These are one person’s ports and they are not even close to being independent (the data is not IID and not even close). And 30 is still a pretty small sample which aggravates this problem. As an example of not being independent, some ports used the same ranking system.
Anyway I did not do that with statistics here. The mean or median, perhaps the range and maybe the inter-quartile range could be looked at and people can do that with (and whatever other manipulations they wish) with this data. Just do not accuse me of bad statistics: the median or mean are the best unbiased estimates we have.
So I sorted the data (see below) and it looks like the port performed better than the sim in 5 cases.
I highlighted one sim and port in peach where the sim and port were close (port beating sim). This was an SP 500 universe and did not use earnings estimates.
Anecdotally this seem to hold.
I am considering the possibility that one of my ports with no sentiment and a SP 500 universe might have some value to me.
But I would not mind understanding how good/bad the earnings estimate data is, specifically.
One last note: not too good on those ports that I developed 5 years ago. Although not necessarily worse than some of the desingers. Especially considering that they have almost universally removed their worst performing models. Olikea is an example of someone who is gone now and has stopped removing his Designer Models. Maybe there is less selection bias in his models. He is EXTREMELY savvy and intelligent: I hope he is doing well wherever he is. People should look there—before looking at my models—if the want an unbiased sample of a savvy investor’s out-of sample results.
Olikea has 24 Designer Models—all with at least 2 years of data with at least 2 years of excess returns. BTW, median of those 2-year excess returns: -34.17.
Am I judging now or am I just having a natural reaction when I say: Whoa! Knowing me, probably judging but to be fair I am having some palpitations, feeling some chest pain and wondering why I do not keep some nitroglycerin tablets around the house after seeing that number for the first time. That is something to think about.
Anyway, forgive me for my natural curiosity. I wonder how good those models (Olikea’s) would look now in a backtest.
There are more problems than look-ahead bias in my old ports (and the Designer Models).
One thing I find entertaining about CNN and Fox news is how the same person can change their opinion literally overnight and no one seems to notice.
The backtests were sooooo important to the members not too long ago. But I do not think that was ever your position, Yuval. I might be wrong (an please correct me if I am wrong) but you have use a lot of techniques that I would generally put into the category of cross-validation. You may disagree on the names but good techniques by any name, IMHO.
Now the cool new thing with members is…… Well, not backtests. Okay, got it.
Yuval, these are good questions. Today, after looking at CNN and Fox news I might come back to P123 for relief (reversing my usual weekend viewing habits).
Let me know if I can do some further manipulations on the data. And do not forget that some of the Designer Models have been around for 5 years if you want a larger sample with a more diverse group of people designing the models.
Thank you for your interest and excellent comments.
[b]Edit: I am happy to share my data. But I wonder if you could looking at Olikea’s models using the following: “In order to properly compare a live strategy to a simulation, you need to run it using the average of high and low and next close and take the average of those.”
No one will accuse Olikea of knowing ahead-of-time that we would be discussing this. He is a savvy investor which is good. There are no recent revisions in his models. And I think his models are pretty diverse with a decent sample size. I cannot do that and I am out of data.[/b]
Thank you, Jim, for answering my questions, and for providing the data. This was a valuable study indeed, and the results bear thinking about quite seriously.
I’d like to point out a few facts about this data.
First the correlation between the two is quite strong: 0.76. That’s not so bad considering these systems were based on completely different data providers.
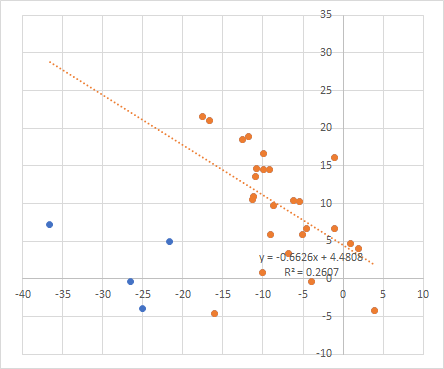
Second, the fact that the sims performed better than the live strategies could be due entirely to mean reversion since the live strategies performed so poorly. These are five-year live strategies, during which the Russell 2000 had a CAGR of 8.58%. Yet your live strategies had a median return of -9.92%. If they had a median return of +9.92%, do you think the simulations would have a median return of 18% or 22%? If you conclude that simulations tend to outperform live strategies by about 8.5% based on this data, that would be your conclusion. But it might make more sense, given this data, to conclude that simulations will vary significantly from live strategies due to different data providers, and if the live strategies perform very poorly, then simulations will perform better, while if the live strategies perform very well, simulations will perform worse.
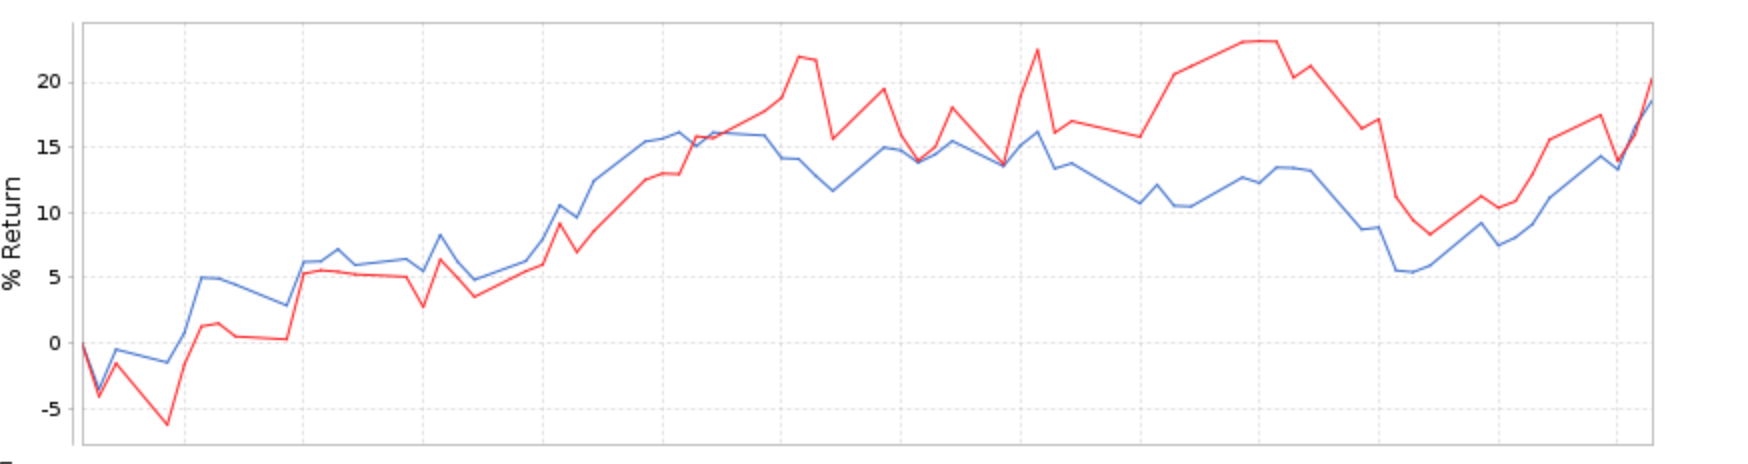
To back this up, here is a scatterplot of your first and third columns, live strategy return on the X axis and the difference on the Y axis. If you ignore the outliers, where the live strategy return was EXTREMELY bad, the slope of the linear regression is -0.66. This is more or less what you’d expect: as the returns get higher, the difference gets lower. If you extrapolate from the trendline, you’d see that if your live strategies had returns of greater than 7%, they would likely outperform the sims. (I realize that by ignoring the outliers, I’m manipulating the data in favor of my point, but I always trim outliers when doing linear regression, and my eyes tell me that those lowest three or four X points don’t really fit with the rest of the data.)
Jim, I think you might be entirely right that sims based on FactSet data will tend to outperform live strategies based primarily on Compustat data. It certainly merits further exploration, which I’ll try to do sometime this week as time permits. But there is another possibility that explains this data equally well, and that is my hypothesis that sims will outperform live strategies when those live strategies perform very poorly and will underperform live strategies when those strategies perform very well, simply because of the principle of mean reversion.
Now I don’t know if the following experiment will convince you that FactSet’s not-very-PIT simulations aren’t very different from Compustat’s quite-PIT simulations, but here goes.
A while back I created 48 ranking systems based on the AAII screens.
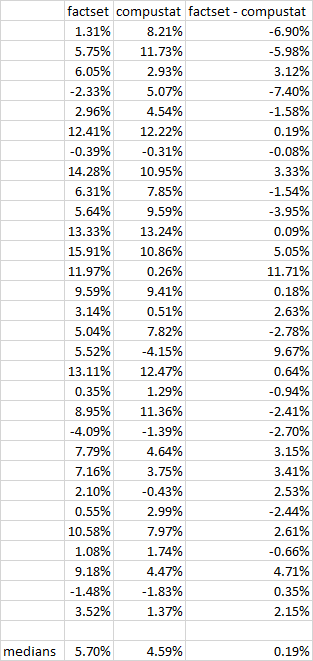
I took the first thirty of those ranking systems in alphabetical order and created simulations based on them, buying the top twenty stocks every four weeks and selling when their rank position went down to 100, over the last five years, with a pretty wide universe in terms of liquidity. I then ran the sims using both FactSet and Compustat data.
I’m pasting the results below. You’ll see the median advantage that FactSet has over Compustat is 0.19%. The correlation between the two sets of data is 0.66.
Now this is not the same as your experiment, I admit, which compared live strategies to simulations. But maybe you’ll find this data useful. If not, I tried.
I would like to add one more thought about the PIT vs non-PIT issue. The idea that non-PIT simulations would outperform live strategies in general must rest on some theoretical basis. The unstated hypothesis seems to be that data with look-ahead bias will give better results than data without look-ahead bias. That is certainly true of any process in which the data is taken into account prior to establishment of the strategy. However, in the examples we’re looking at here, that is not the case. The strategies were established prior to looking at the data. So data that has look-ahead bias will offer no advantage over data that is not subject to look-ahead bias.
In terms of strategy development, it is optimal to limit look-ahead bias to a minimum. But in terms of testing old strategies, it should make no difference.
My main purpose for this post is to making people aware of one possible way of addressing any look-ahead bias that they think may exist. If you have not already thought of this or used this, that is.
I have not looked at any of the posts since my last post with the exception of your (Nisser’s) post. I apologize if this means I am unresponsive to any valid points addressed to me.
Nisser, thank you for sharing your data.
One way to address this would be to add a lag as Quantopain does with its earnings estimates data.
P123 says this would be hard to do.
But you can do it easily as a member and perhaps you do not need additional help from P123 if you want to see what a lag does. P123 is a flexible platform.
You can:
Add the buy rule and sell rule: weekday=3 (3 causes a port to buy one Tuesday, 4 on Wednesday….)
Note: you must also also add AND weekday=3 at the end of each rule. If you want more of a lag for some reason you could set Weekday= 4 or greater.
You must then switch your rebalance frequency to daily.
I have done this. It seems that I can still overfit my sims and make them look pretty good in-sample (but not as good). BTW, there is a different type of look-ahead bias at work with my sims. One unrelated to the quality of FactSet’s data. I keep trying ideas that I already know have worked for some of my ports. But perhaps that is just me and not a concern for anyone else.
In fact, I seem to be able to overfit my data with the maximum lag possible using this method (Weekday = 6 or Friday). If you can do the same with a sim that you do not think is overfit then you should probably fund the port (if it has adequate risk adjusted returns for you needs).
There is no black and white answer with the data we have so far (I think). What to do would depend on your assumptions about how important you think any look-ahead bias might be, your understanding of overfitting in relation to your models, your understanding of regression-toward-the-mean, mean regression (which is different), concerns about changes in market regimes, and how you look at risk adjusted returns (if you consider this).
In other words this is only part of any concerns about the (aggregate) out-of-sample returns for the designer models, my ports on auto and now some of Nisser’s out-of-sample returns. As well as the modest risk-adjusted returns of even some of the best models out-of sample. But this is another topic and can be summed up by observing that the median Sharpe ratio of the Designer Models is 0.28 and this is with the benefit of removal of the worst models by the designers (survivorship bias).
If I use P123 data for investing again in the future I will probably use a day lag on all of my sims that use earnings estimates data. Of course this will not address any look-ahead bias in the rank performance testing. Note, CapitalIQ earnings estimates data has the same potential problems as FactSet earnings estimates data. I think I would introduce the lag before I would pay $15,000 annually for CapitalIQ data. At a minimum, I would want have some objective evidence that CompuStat/CapitalIQ data is superior before I would spend $15,000 per year on it.
Thank you Nisser for introducing this important topic and for sharing your data.
Edit: I did end up skimming some of the other comments but without putting a lot of thought into them or trying to prove (or disprove) any of them in my mind. I would place a low plausibility (a priori) on some of the hypotheses and some of the discussion was off topic (as were some of my comments). But I think all of the comments were good. There is nothing wrong with listing all of the possible explanations or with discussing related topics. So I want to thank everyone for their comments.
In the end its just about finding the right place for you money. A lag could help if you are worried about apossible look-ahead bias.