Was the Greenblatt ranking system changed yet again? One of my best models just tanked again (after tanking previously with the change to FactSet). The backtest performance has dropped roughly in half from the last time I checked, maybe a week ago.
Please advise, and if so please advise of what the changes were to the ranking.
I’m seeing some differences in simulation results between yesterday and today. They’re bigger than I usually see but not necessarily alarming. Perhaps the weekend data update is the root-cause of the reported problem.
I am seeing some major differences between my live sims (built when compustat was default) and equivalent simulations. Since I use mostly fundamental factors I wonder where the differences come from
A few others and myself did complain about massive differences on GB (or close affiliates) ranking systems back in May / June when shifting from Compustat to Factset. As of today, I have not found a way to make it more “Factset-compatible”. Any bright idea welcomed…
I was otherwise distracted in June. But if anyone has kept record of the ranking during that time, we could try to see which companies were ranked differently and why
As for Greenblatt, $EV in particular is vastly different if my memory serves me correctly.
Yuval also pointed out that Financial Services are treated very differently between Factset and Compustat. Apparently Compustat “massages” the numbers for FS to make them comparable. Whatever they did, it was working well for me and the Factset change remains an issue.
Interesting article as usual (I just skimmed through but will take the time to do it well later). Thank you.
But to answer the question in this thread, you would need to compare the results of your system using Factset vs Compustat, no?
(I assume you only used Factset here)
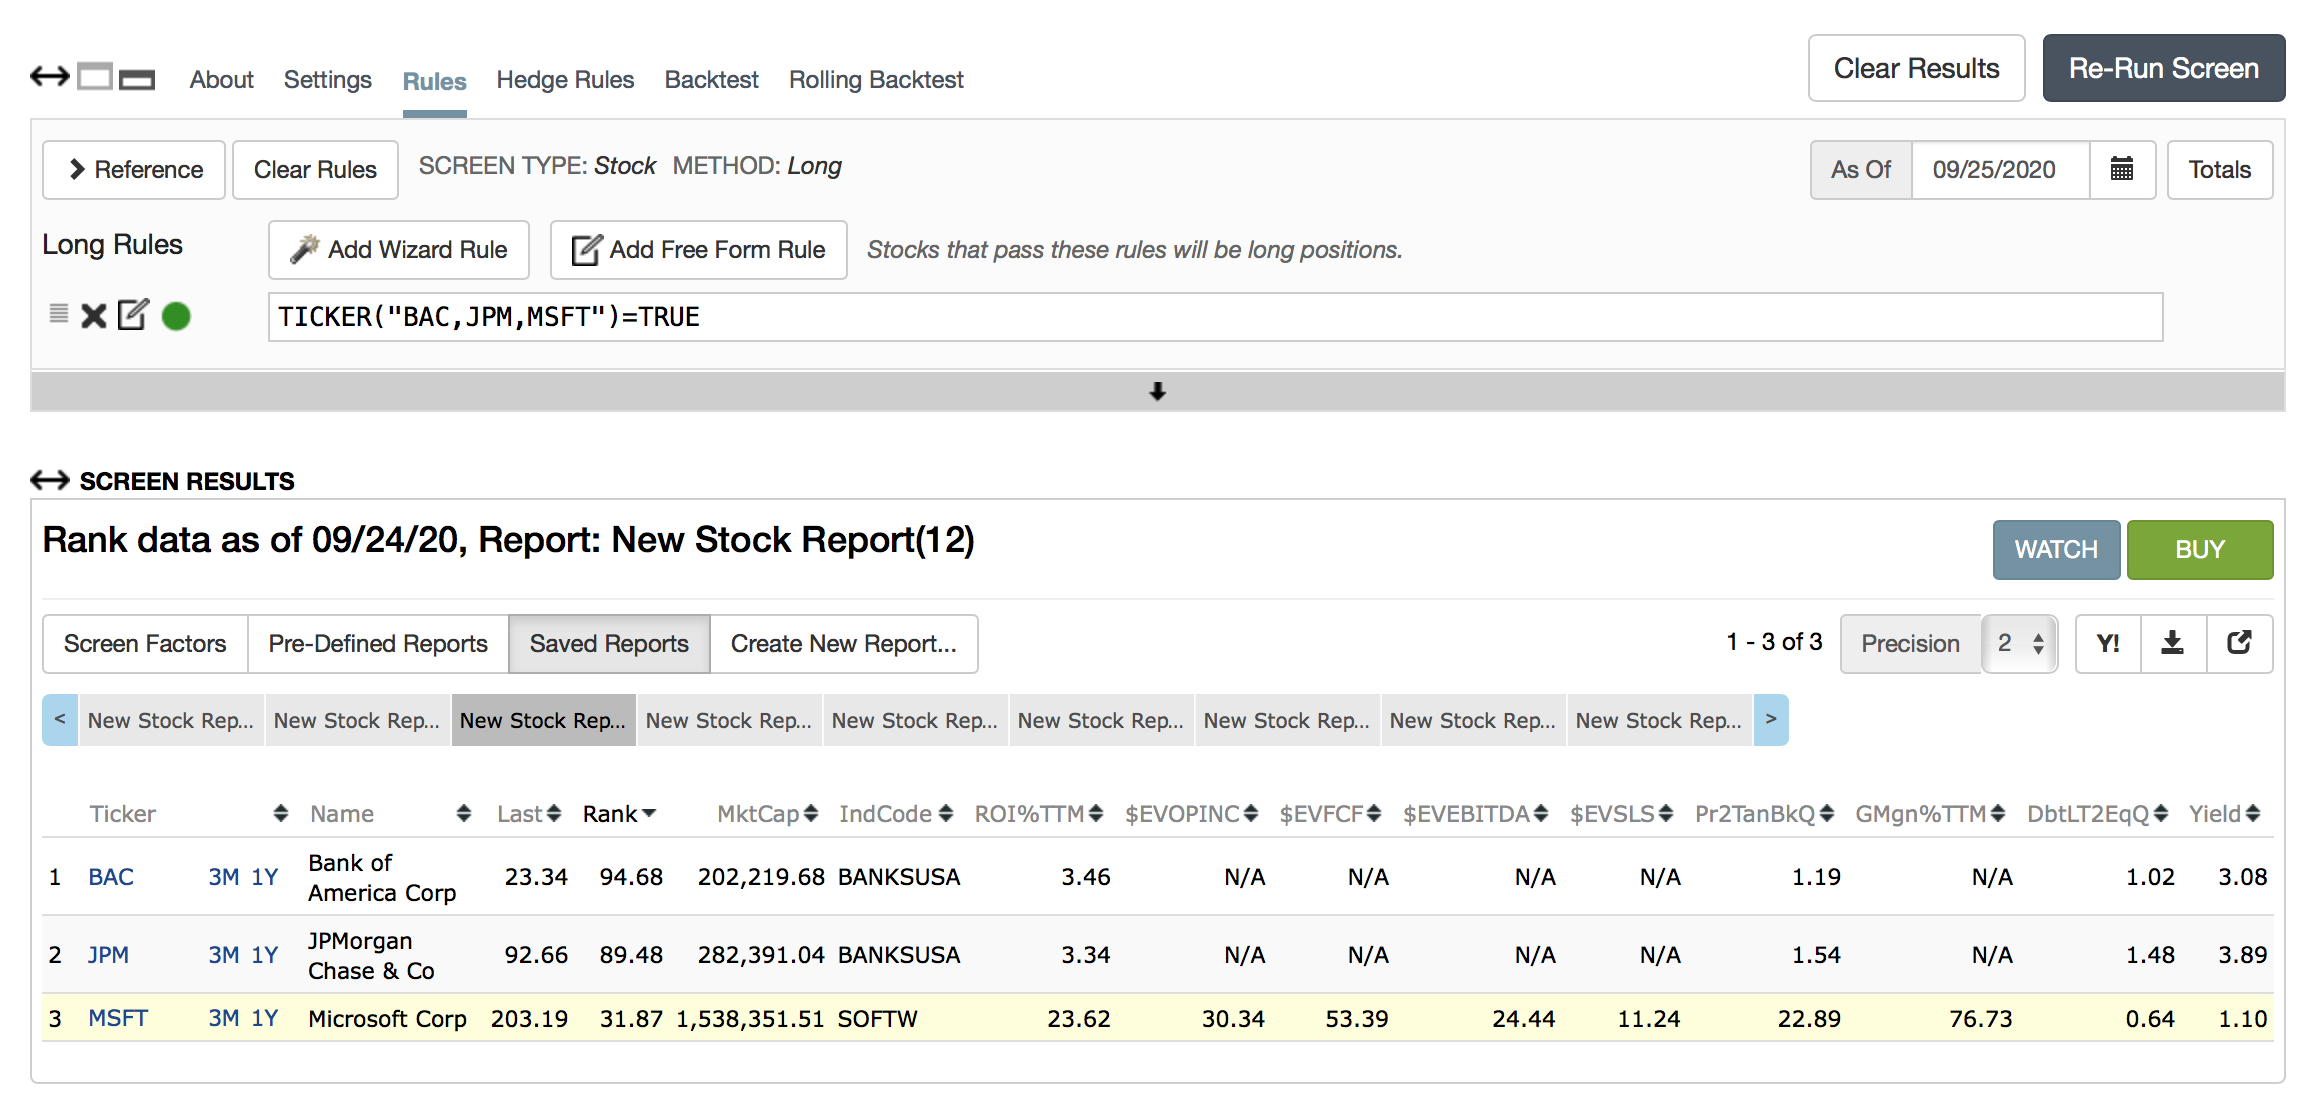
I believe I found the issue - Enterprise Value/Sales has been disabled again for financials. I do recall a long discussion on this earlier, with Yuval’s opposition, but in any event this metric was working again - until last week anyway. Now this ratio no longer works for financials. I understand that Greenblatt didn’t include financials in his initial model, but I found that this metric was indeed very very helpful. And for what it’s worth my “bank” strategy, which doesn’t use Greenblatt at all, has stopped working completely, because using Enterprise Value/Sales is disabled. Again, I found this metric, as a secondary input, had proven to be very helpful. Frustrating, as having to work within the “academic” constraints would mean poorer returns for my strategies.
Can we please enable the Enterprise Value/Sales for all stocks? If caveat emptor applies, so be it, I’ll take responsibility for my results.
I’m afraid I don’t understand the problem here. EV/SalesTTM functions just as it should, whether it’s a financial company or not. It hasn’t been “disabled” as far as I can tell.
There are a few companies for which EV = NA, but not that many.
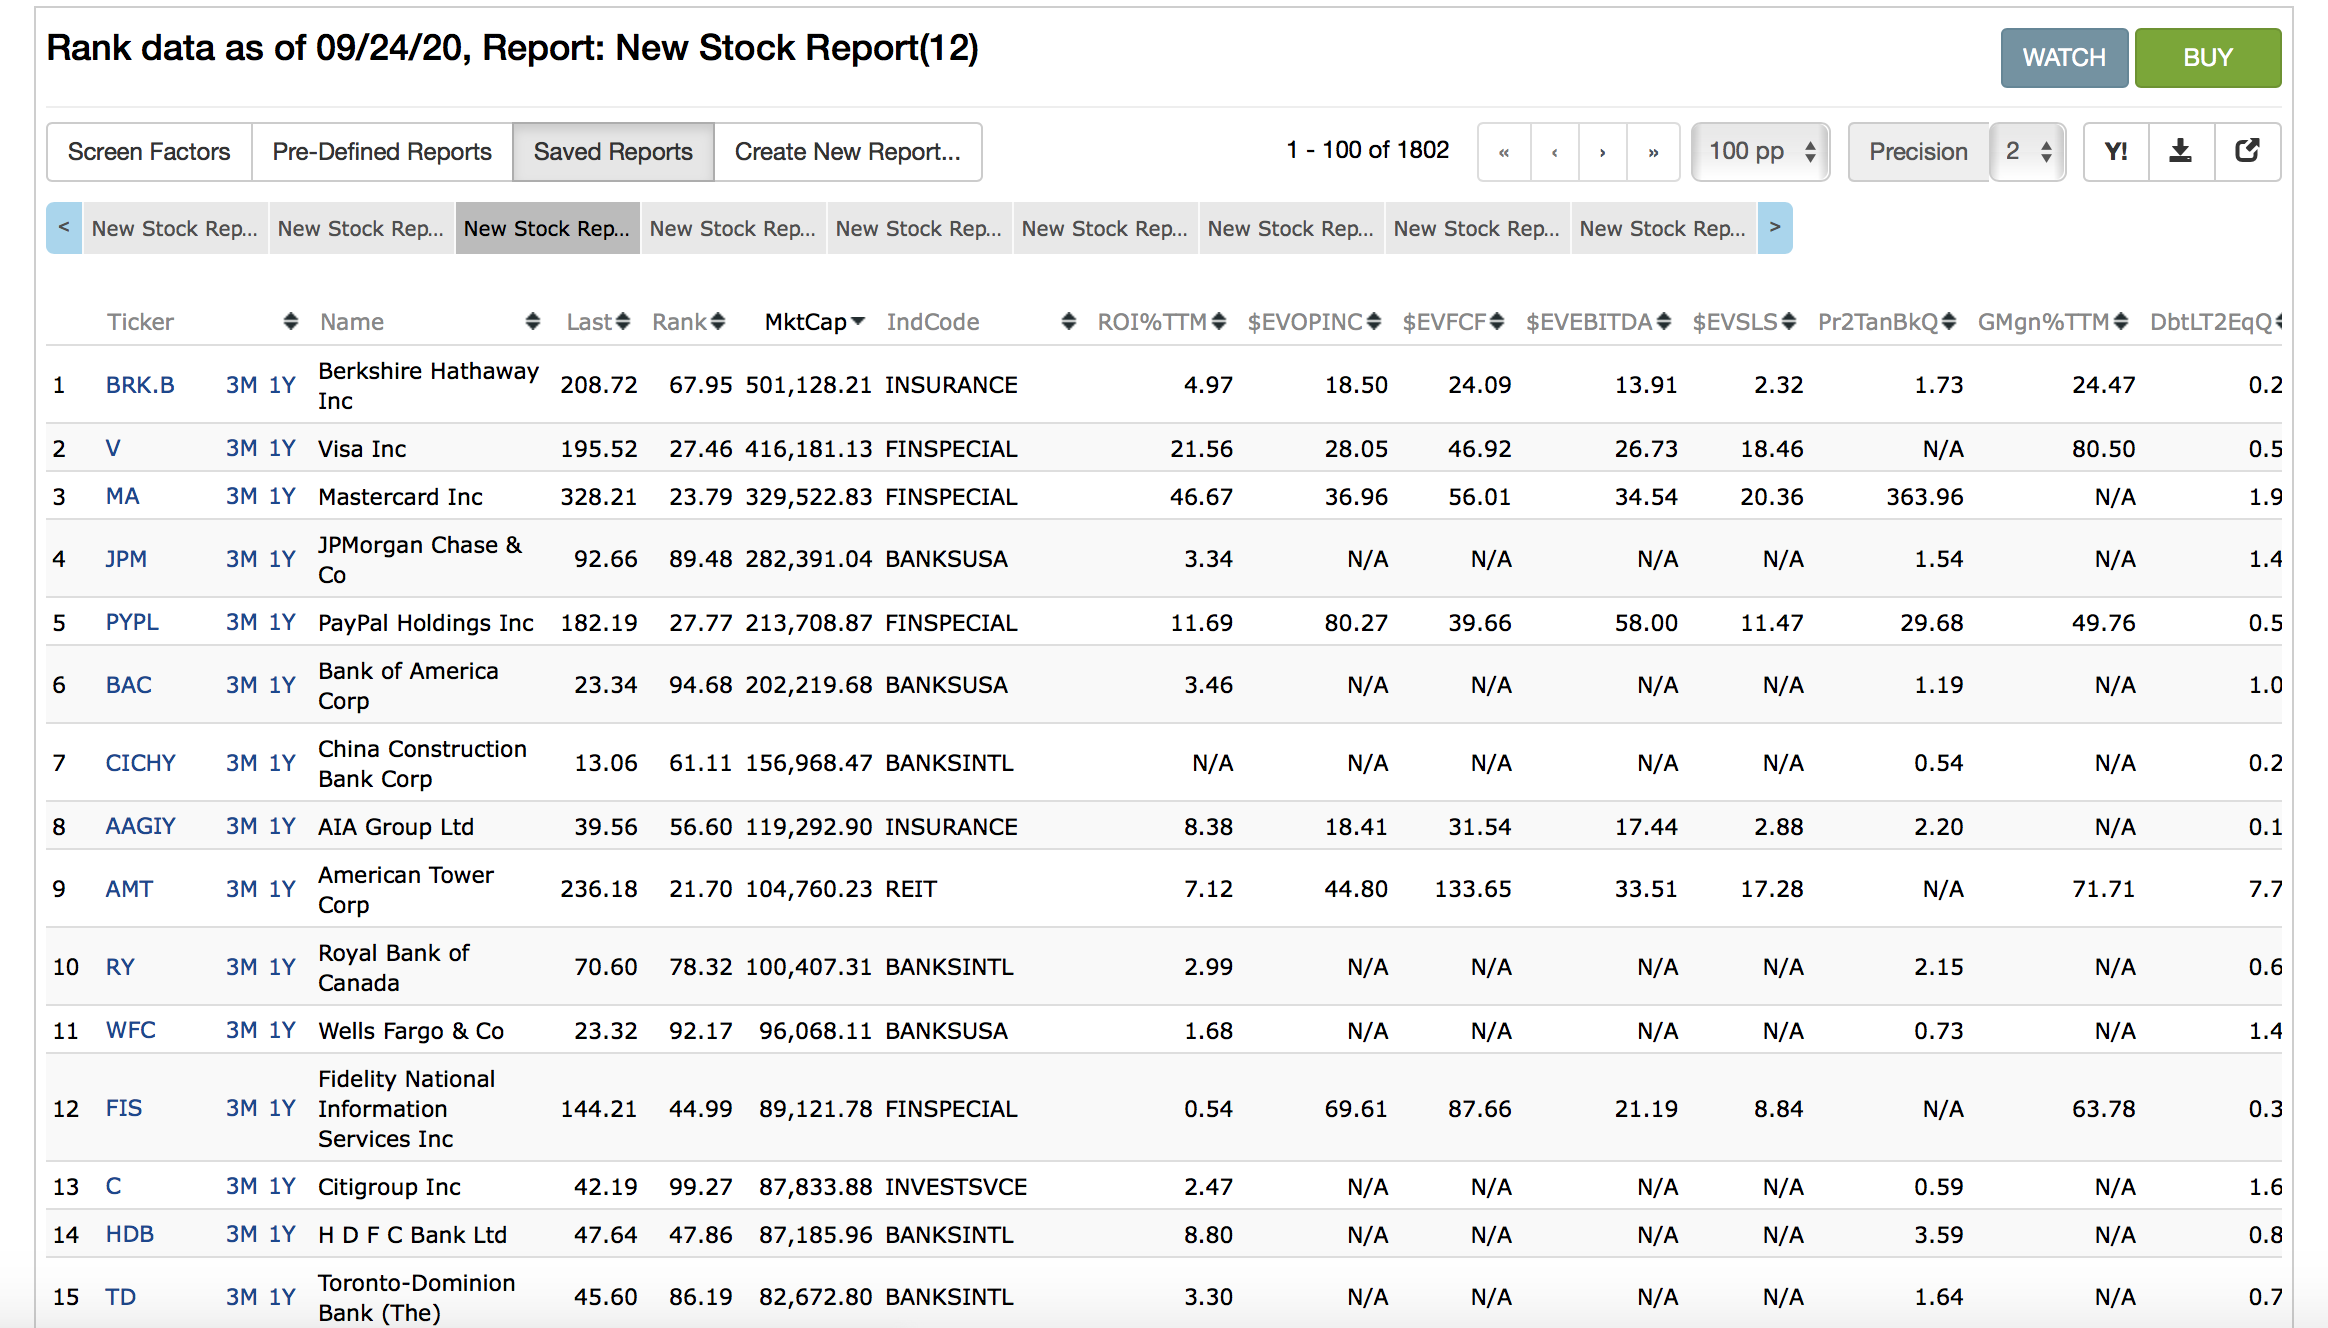
I do too, which makes this such a mystery as to why the ratio fails. Fwiw a cursory review suggests it only fails for these industries within financials:
BANKSUSA
BANKSINTL
INVESTSVCE
See attached.
It works for most insurers, except some international ones.
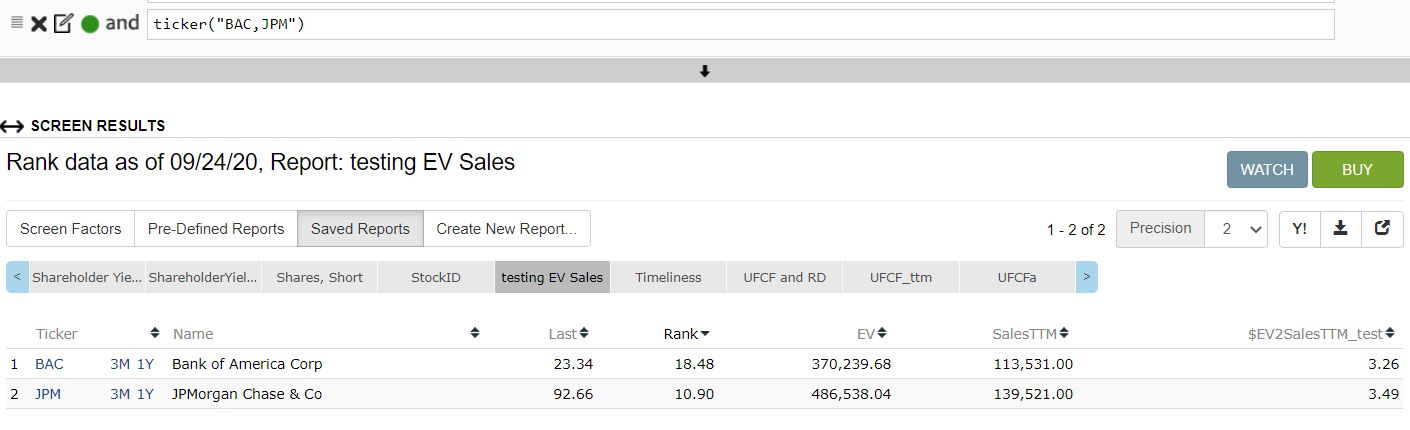
Maybe try inputing a new formula, just to test if it’s something with that particular custom formula being corrupted? I created a custom EV2SalesTTM formula for the view shown above (see column at far right of my screenshot) and the calculation worked at least for me. Makes me wonder if something about the custom formula is bugged? Anyhow, hope you can find the issue.