Increase in last Quarters?

Hi all!!

I need help with a part of a rank I’m trying to develop.

The idea it’s very easy, I want to order the stocks by their increase in EPS the last 4 quarters, quarter by quarter, like a slope. The higher the better.

For instance, I’m looking for something like this:

Q1: 0’10
Q2: 0’20
Q3: 0’40
Q4: 0’60

I check the quarters/EPS in the panels. But it do not work.

Is the problem the factor I use, maybe?

Or there is a better way to do it?

That’s how my rank looks like:

LoopStdDev(“EPSExclXor (CTR,QTR)/EPSExclXor (CTR+1,QTR)”,4)


Let’s start with this: “I check the quarters/EPS in the panels. But it do not work.”

What are you referring to when you say “it does not work”? i.e. What are you expecting?

Yeah, sorry, you right.

Let me explain better:

The first company, by rank, their EPS, quarter by quarter are not rising.

And the rank just has this node, nothing else. So I guess It do not work properly.

For instance, this is the first company and their EPS, and the few buy/sell rules I have:


So the first problem that you have is that you are dividing the EPS by the previous quarter EPS. This doesn’t work well in the case of negative EPS. You might want to consider subtracting instead of dividing. But then you have the problem of scale i.e. small companies will not rank well as a result of small change in EPS. As an alternative, you could count the quarters that have rising EPS.

Steve

Ok, it looks like I have a lot of problems. :smiley:

About the negative EPS I think I can avoid them with this rule in “buy rules”:

EPSExclXorQ >0 and EPSExclXorPQ >0

Just for the last two quarters, I don’t know how to go back two quarters more…

But, How could I count the quarters that have rising EPS?

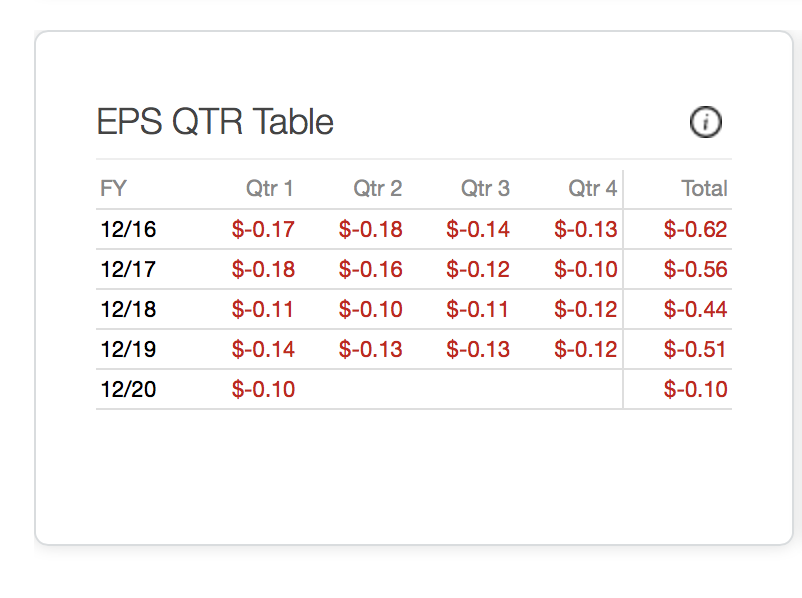
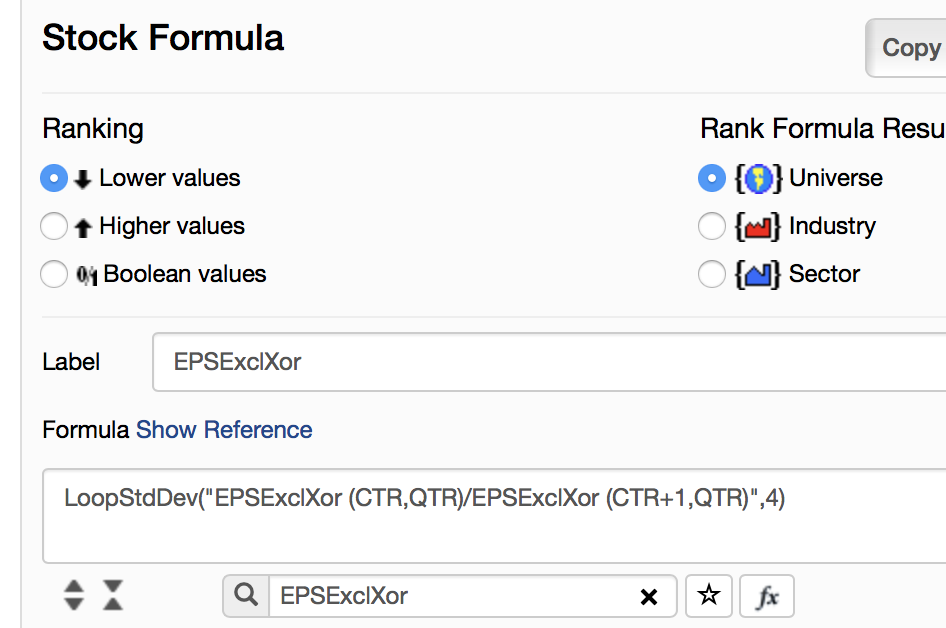
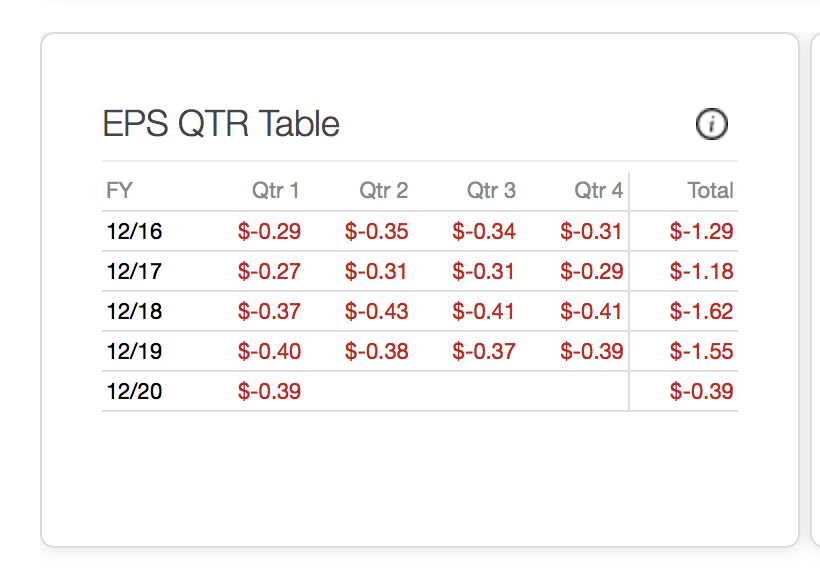
If I’m reading this right, the condition that you described – the highest slope – would be the greatest difference between the EPS four quarters ago and the most recent quarter, expressed as a ratio. If a>b and b>c and c>d, and you wanted to get the maximum distance between each of them, then you’d just like the difference between a and d.

That would simply be:

(EPSExclXor(0,TTM)-EPSExclXor(4,TTM))/abs(EPSExclXor(4,TTM))

By using abs, you’re eliminating the problem of negative earnings. This is, by the way, fundamentally the same as the existing factor EPS%ChgTTM.

There is no particular reason that you couldn’t do it for the last 20 quarters, though, if you use the formulas.

(EPSExclXor(0,TTM)-EPSExclXor(20,TTM))/abs(EPSExclXor(20,TTM))

These are the terms that you’d rank on.

If you want to ensure that a company never backsteps in those 20 quarters, you’d use this rule:

LoopSum("EPSExclXor(CTR,TTM)>EPSExclXor(CTR+1,TTM)",20)=20

It is simply counting the number of prior quarters that are higher than the quarter beforehand.

I would note that this approach eliminates anything that’s regularly seasonal. For example, no retail company will ever pass (because Q4 is usually much higher than Q1).

Using abs() in the denominator introduces a new also undesirable issue. EPS numbers close to zero, either negative or positive, will give very large results. You will, in fact, end up highly-ranking stocks that have EPS close to zero, or ranking them very low depending on what the rank criteria turns out to be.

Yes and this is a problem because the factor is not really a change in EPS.

I wish there was a Slope function in p123 where you could pass it a list of data points (q0,1,2,3 eps as an example) and get the slope returned. But I dont know of any way to do that directly. The best option I can think of is to create a ranking system with 2 parts. The first part uses boolean rules like EPSExclXor(0,QTR) > EPSExclXor(1,QTR). Have a formula like that for each quarter. Then the stocks that had their eps increase qtr over qtr for each of the last 4 quarters would get the highest rank. Boolean rules act like the counter you had mentioned.

The second part has 4 formulas (one for each qtr) like (EPSExclXor(0,QTR) - EPSExclXor(1,QTR)) / abs(EPSExclXor(1,QTR)). I created a public ranking system called “eps increase q over q” that does this.

Adjust the weight between the 2 branches as you see fit. For example, if having the eps increase each quarter is critical to you, then give the first branch 75% weight and the second one only 25%.

You could use this ranking system directly in your system, but remember that adding any additional factors/formulas to that ranking system would dilute the weight of those EPS factors. If you wanted to be sure that all stocks selected were ranked very high in just the EPS growth factors, then use some other ranking system with your system, but add a buy rule like Rating(“eps increase q over q”)>85. The 85 is somewhat random, but using a high number like that guarantees that it will only buy stocks with a combination of eps increasing qtr over qtr for most or all 4 of the qtrs and also relatively high growth qtr over qtr.

Yup. Weird things happen around zero. That’s baked into, umm, math.

And consider that Portfolio123 retains, as I recall, eight digits in the underlying data. So if a company’s EPS is, say, $0.00000001 and it then goes up to $0.01, then its change is 99,999,990%. That should rank pretty well.

“I don’t want an EPS close to zero” is effectively a new parameter. If you’re not happy with that example, then I would use something like

EPS%ChgTTM<500

Or something as a rule. You’d have to determine what an appropriate level is for you with testing.

By the way, if a company went from -$0.01 to $0.01, I would consider that to be a very big, very positive change. Just sayin’.

And to address the recurring theme here, what people seem to be asking for is regression analysis. We have resisted that for years, and so far as I know we have no plans to add it now.

Here’s the formula for the linear regression of the slope of the EPS for the last four quarters.

(3EPSExclXor(0,Qtr)+EPSExclXor(1,Qtr)-EPSExclXor(2,Qtr)-3EPSExclXor(3,Qtr))/9

Stocks that rank highly using this formula will have high slopes.

If you’re looking for consistent EPS quarterly increases, this is the formula you want: LoopSum(“EPSExclXor(Ctr,Qtr) > EPSExclXor(Ctr+1,Qtr)”,4,0). To avoid the problem that Paul points out, you might want to use a number significantly greater than 4 here.

If wanting results that have any sort of meaning or usefulness, then you can look at it as a new parameter.

This needs to be normalied by something, perhaps the sales. Otherwise, the largest company wins.

Steve, Yuval, Paul and Dan, thank you so much for your help. This is all I need. :slight_smile:

By the way, I would like to say that maybe we need a section or a tutorial in P123, maybe in “Research/Step by Step tutorials”, or somewhere, where to find examples and explanations of formulas for dumb people like me.

I’m very bad at maths, and despite having a clear idea of what I’m looking for, sometimes it’s tough to write it down in a formula. From time to time that’s a great inconvenient, and I feel I do not use the full potential of the platform because of it.

I know in “Factor Reference” we have few examples of formulas for those factors, but would be very useful to have more examples, and explained in more detail.

Also, the benefits for you will be to avoid explaining the same thing again and again here in the forum. I’m sure you don’t enjoy it very much.

Thanks again.