Yuval, thanks for the spreadsheet.
I’ve attached an updated spreadsheet with Sector info and the Sharholder Yield calculations.
Comparing compustat and factset data, within the SP500, it looks like the numbers are close enough that the rank order wouldn’t change much. The only real difference appears to be the number of NA’s. Factset has 3 N/A’s for Shareholde Yield vs 61 in Compustat. For NONCYCLICAL it’s 1 vs 7. Maybe there were just a lot of NA’s before.
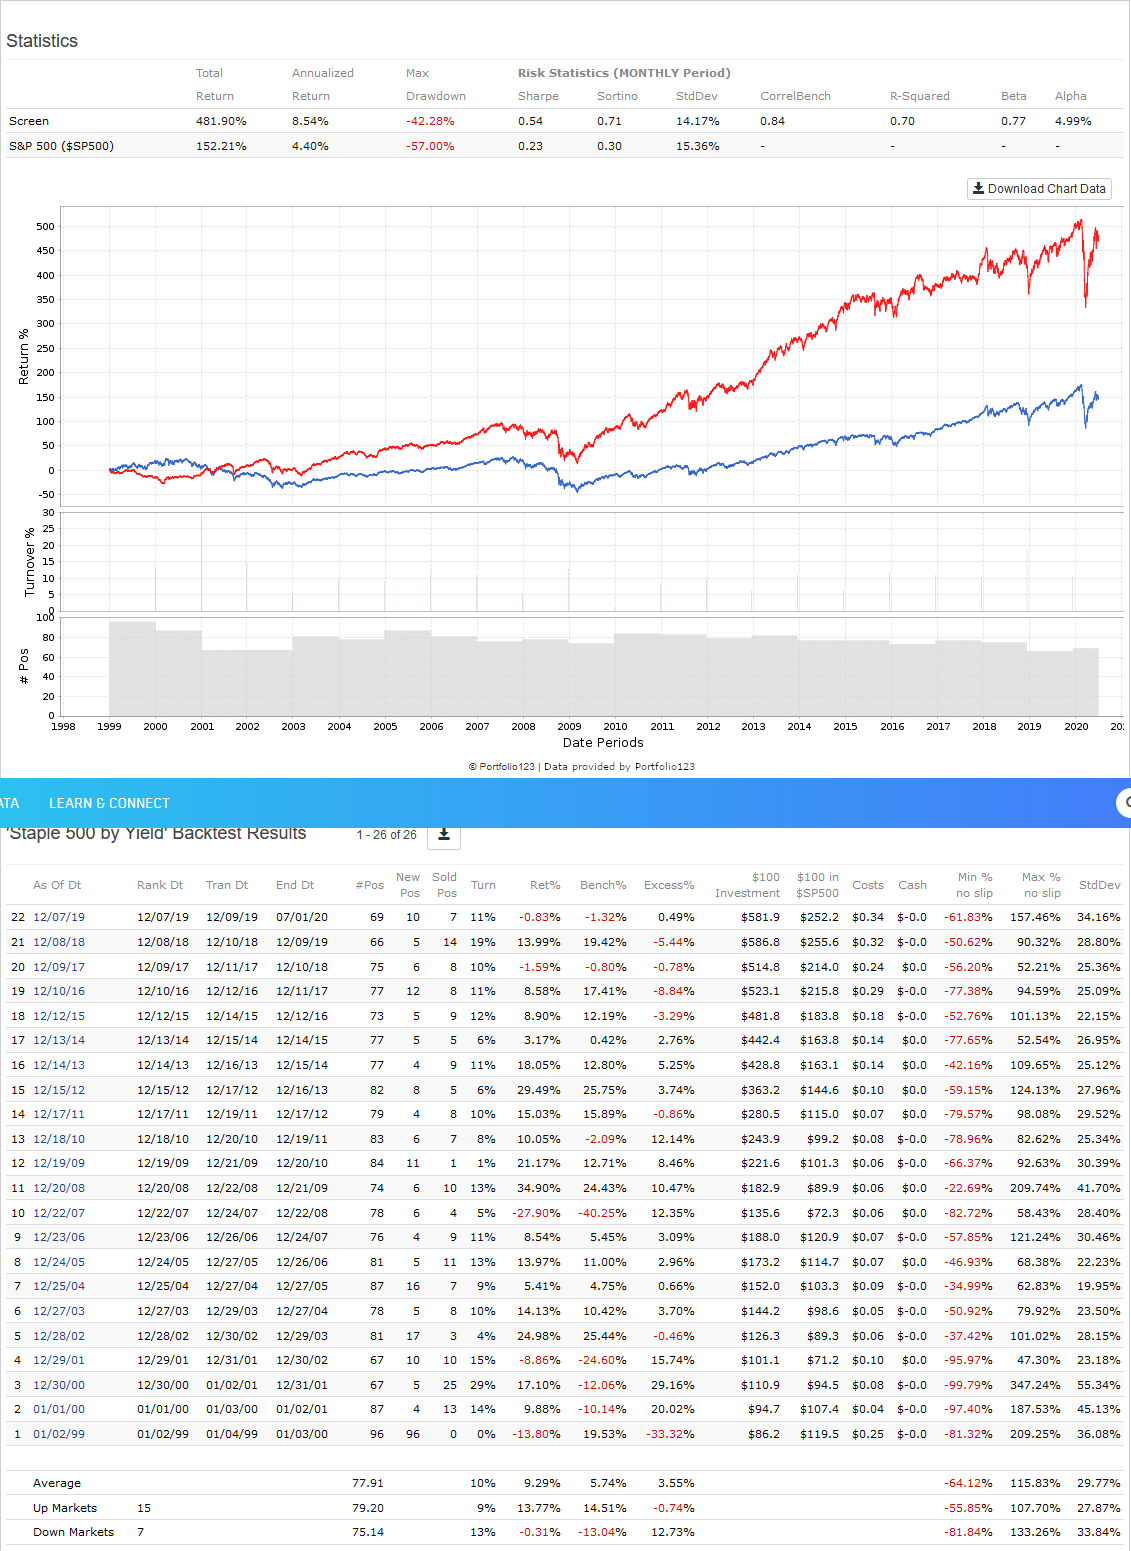
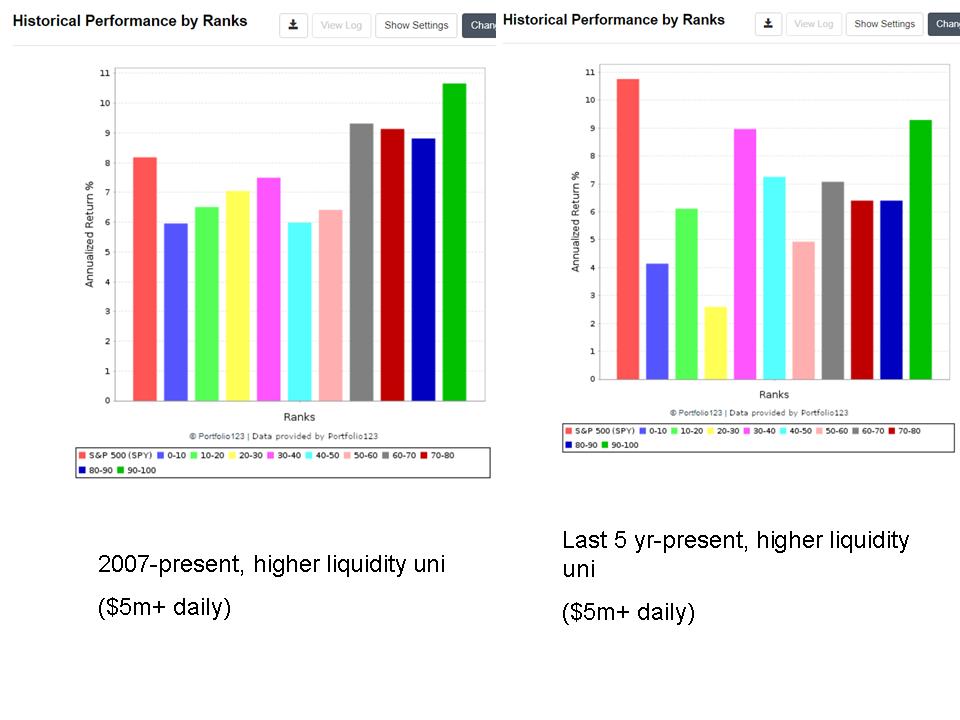
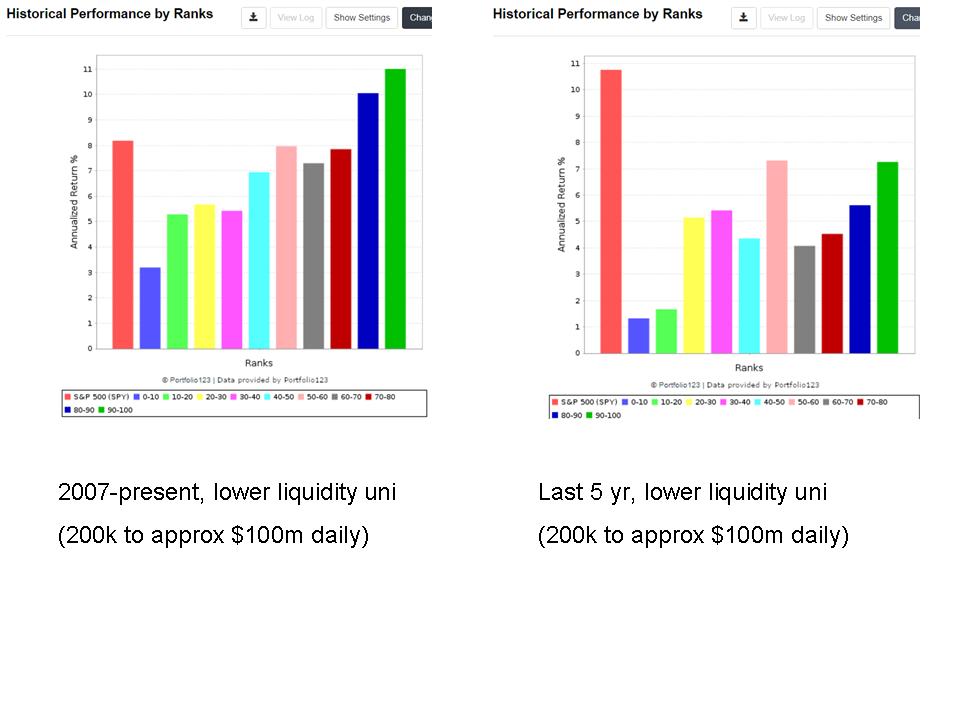
The results are worse (in favor of Yield) using a bigger universe.
Universe: NO OTC
frank(“mktcap”)>50
AvgDailyTot(20)>500000
RBICS(50) // NONCYCLICAL
there are 158 stocks as of 7/1/2020
Using a rolling backtest, every 4 weeks, holding for 1 year:
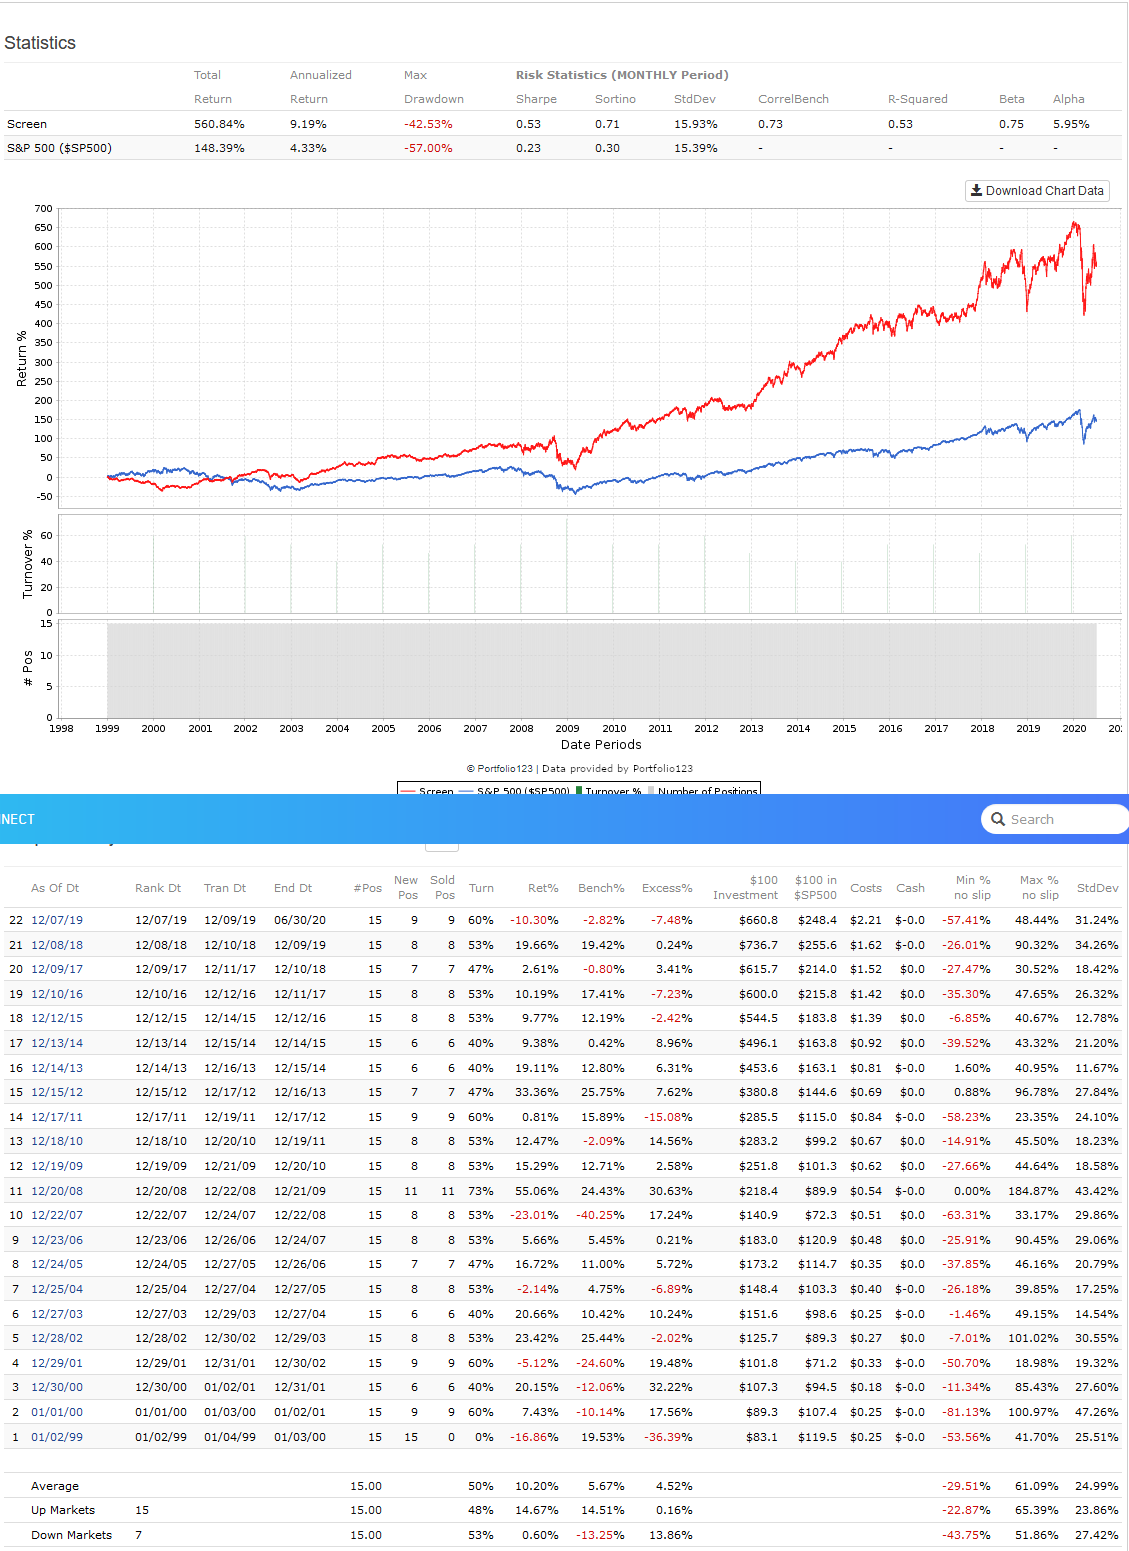
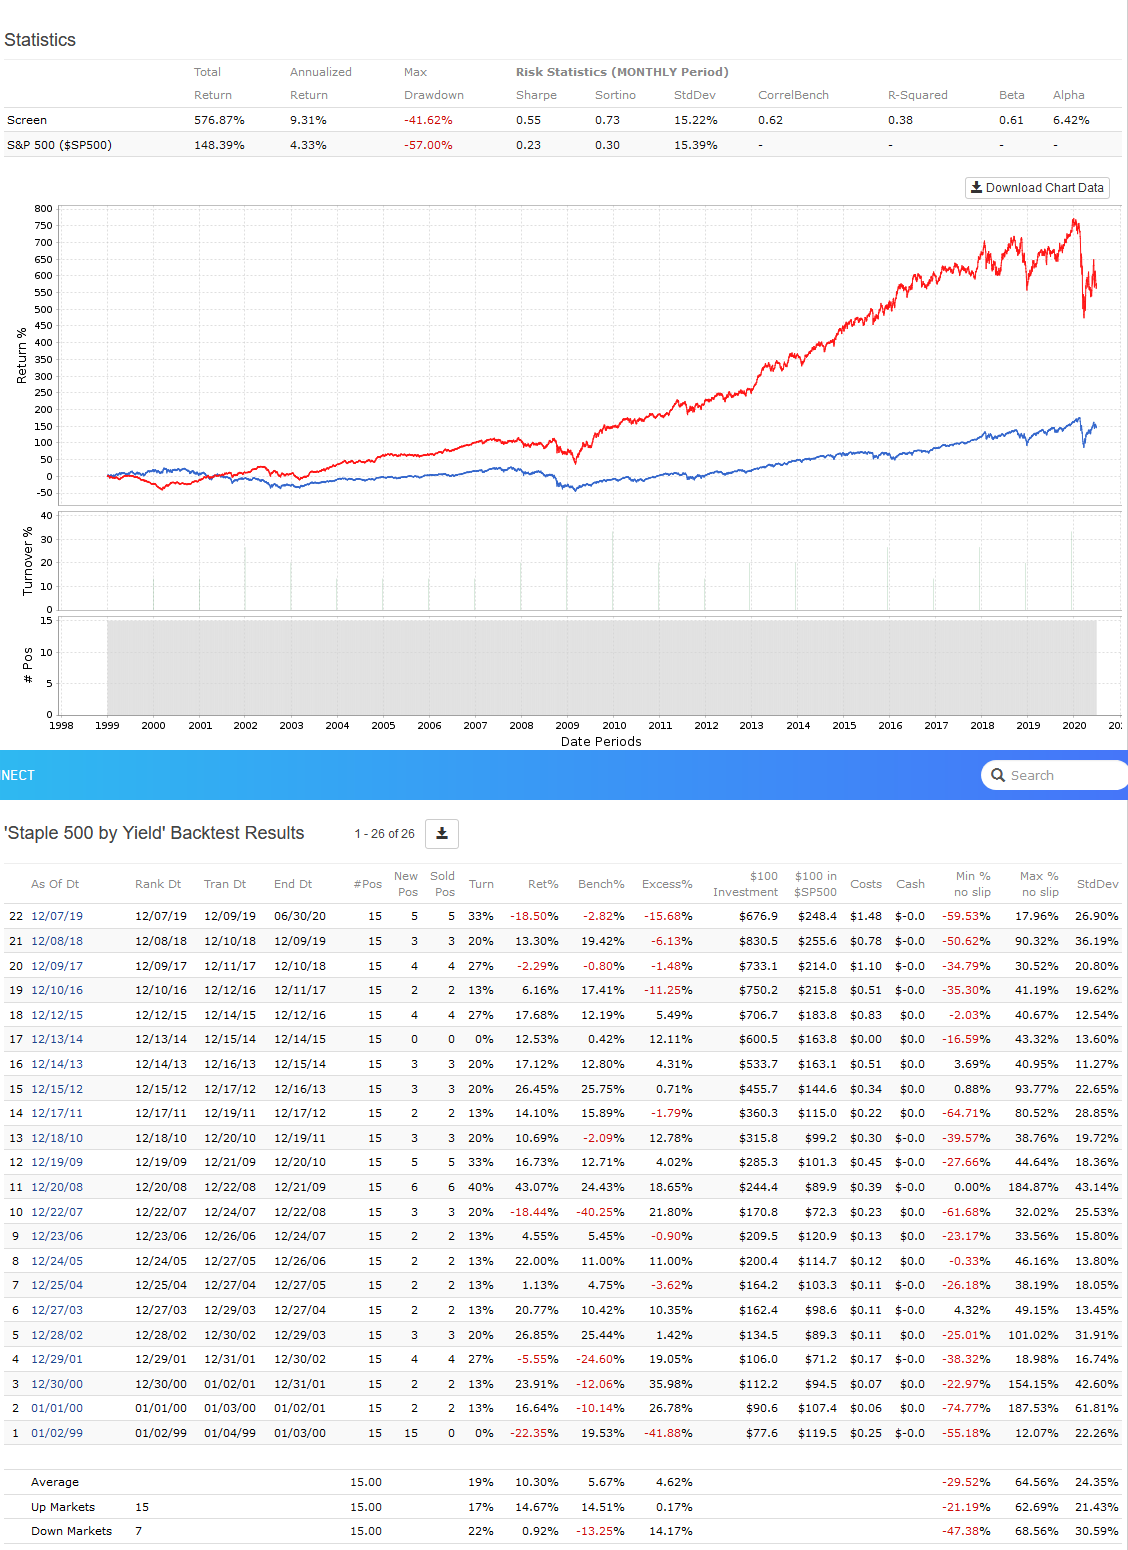
15 stocks
Shareholder Yield = 10.11%
Yield = 14.60%
Core: Quality = 11.70%
30 stocks
Shareholder Yield = 10.32%
Yield = 11.96%
Core: Quality = 10.81%
Everything I’ve read, and previously tested, had shareholder yield outperforming yield. And it makes sense it would be that way.
Using O’Shaughnessey Enhanced Dividend style system
Universe: NO OTC
frank(“MktCap”) > 50
salesttm > 1.5*fmedian(“salesttm”,#previous)
frank(“fcfq”,#previous) > 50
frank(“EBITTTM/EV”,#previous) > 50
there are 234 stocks as of 7/1/2020
Using a rolling backtest, every 4 weeks, holding for 1 year:
15 stocks
Shareholder Yield = 15.08%
Yield = 14.52%
Core: Quality = 13.89%
30 stocks
Shareholder Yield = 14.60%
Yield = 14.44%
Core: Quality = 12.86%
So this time Shareholder Yield won, but not enough to matter. Something just seems wrong to me.
Georg, thanks for pointing me to Core: Quality. I have been using staple & shareholder yield because it is quite different from my other strategy, solid performance, and I like the simplicity of it.
shareholder+yield+SP+500.xlsx (76.8 KB)