I decided to look at the main financial statement line items to compare both database. I made a one node rank with each line item, cut the universe into deciles (30 stocks) and looked the first date where all the data is available for all stocks. In other words, when the ranking is able to compute the line item for each decile without returning “0”. You will find below the results.
The conclusion is that Factset on average has full data 6.1 years after S&P Global does… And we are talking here of some of the largest financial statement line items, not detailed ones. If I did the same work for detailed ones, I wouldn’t be surprised if the all the data is available only from 2012 and onwards. No wonder strategies that work well with S&P Global don’t work with Factset at all.
I think it’s safe to say you cannot rely on Factset for long-term Canadian Equities backtesting. If anything, the backtest may be reliable only from 2012 and onwards so it is useless to compare backtests between both providers before 2012. Using Factset, you can backtest only one bear market: the latest coronavirus meltdown as we cannot backtest the 2000 tech bubble nor the 2008 great financial crisis due to missing data.
Great job! Very useful Francois. I am impatiently waiting for your US output
In summary, it looks like we are facing 2 issues in this transition:
Availability of data (in the Canadian space, it looks like “anything earning” is only post 2012)
Data reporting in the database is done in a different way - even for the top line P&L item = sales (my post on another thread). Financials and Reits are particularly impacted (but others are too e.g. Boeing)
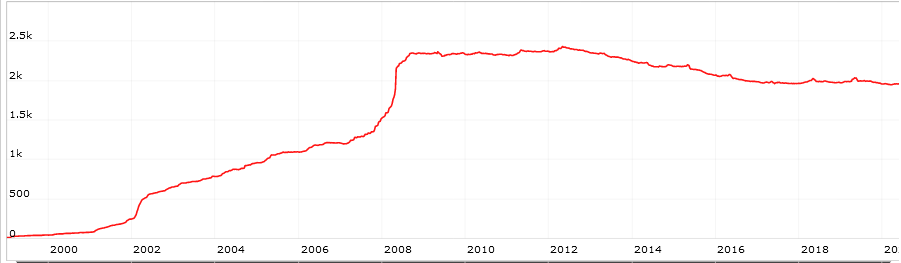
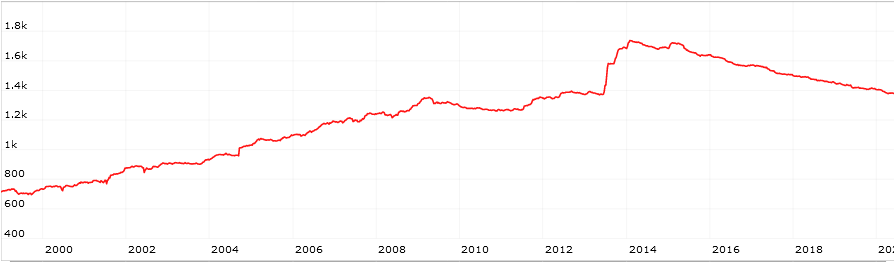
I think your methodology here is off. Take EPSExclXorTTM, for instance. On All Fundamentals (Canada) I get 1,046 stocks with this item out of 1,494 total using FactSet as of 6/9/2005. On Compustat I get 1,028 out of 1,139 stocks. So FactSet’s coverage is actually superior to Compustat’s in 2005. Below I’m pasting two screenshots of the following series: univcnt(“epsexclxorttm <> na”). They’re both run on All Fundamentals (Canada); the first is FactSet, the second is Compustat. FactSet’s coverage is far better: I think that on every single date since 2002, they have more stocks. The problem with your methodology is that FactSet’s All Fundamentals is a lot bigger than Compustat’s so it’s going to include a lot more NAs.
Data is available before the date I indicated, but it’s incomplete to different degree depending on the date. For example if we take NetIncBXor(0,TTM), I wrote the date all data is available on Factset is 2003-10-04. If we take for example 2002-12-28 out of the 300 companies 57 have missing information, that’s 19% of them. You could still make a ranking out of incomplete data but it has its own pitfalls. If your simulation under S&P Global is picking some companies out of those 19%, you are gonna get drastically different backtest results. Also if you may notice on your simulations, there is usually a stale period between 1999-2003 where the system struggles to find stocks. And that’s directly caused by this lack of data I believe.
Yeah you are correct, the normalization of line items is done differently between Factset and S&P Global. So a factor that might backtest well on S&P Global, may not create value added on Factset and vice-versa. This means you cannot “port” your ranking system the way it was made without doing some tweaking past July 1st. I believe this problem has been discussed alot more than point 1) so far. However the goal of this post is to show 1) is as problematic as this 2) point, at least in my eyes.
Post-2002 there is no “lack of data.” There is better coverage under FactSet than under Compustat. This includes more companies with NA and more companies with actual values.
I can’t see how coverage can be a problem with FactSet post-2002. Everything I’ve seen from them shows much better coverage than Compustat. Think of all the huge ADRs that Compustat still doesn’t provide coverage for–Tencent Holdings, Novatek, Samsung, Prosus, WH Group, Reliance, Softbank, Hermes, Iberdrola, Kering, etc. Then there are all the pink sheets. Run some more UnivCnt aggregate series and you’ll see the difference.
Because Compustat is simply not showing companies that it can’t offer the data for.
Look at 2005, for instance. The three biggest companies in FactSet’s database are Ovintiv, Petro-Canada, and TELUS. None of those are in the Compustat database.
You see S&P Global is able to compute 10 deciles right away in 1999 while Factset is only able to compute them in 2008 when the number of stocks reaches above 270 stocks for the first time. Therefore the numbers I shown in my table are still relevant because I get the same outcome with your aggregate time series than my approach of looking at the “backtesting log”. I’m going to edit the log because it’s too much information but here is the turning point where Factset is able to calculate the missing decile.
Right, I get that. But the reason is this. Compustat is not including in its All Fundamentals database a huge number of large and small Canadian stocks for which it has incomplete data. FactSet does include all those stocks, and their data is also more complete. There are still going to be a lot more N/As with FactSet than with Compustat. But FactSet’s coverage is better across the board. If you’re looking to rank the Canadian companies that actually are out there, big companies too, you’re much better off using FactSet. Of those three big companies I mentioned in 2005, all three have EPSExclXorTTM in 2005. Compustat has none of them. Compustat doesn’t even have Weyerhauser back then! Their coverage is terrible. The fact that they have fewer N/As can’t compare to the fact that they didn’t include Canada’s four biggest companies, all of them larger than RBC at the time.
Am I seeing things wrong but I see Ovintiv, Petro-Canada and TELUS in the Compustat database when I select LEGACY - Compustat. PCA is under PCA.Z:CN^09
Also I noticed that when I switch to Current - Factset the footer shows that data comes from S&P Global, you should change that because it gets confusing:
“Data provided by S&P Global Market Intelligence and ICE Data, LLP”
I will ponder on your last post for now and come back when I have an answer.
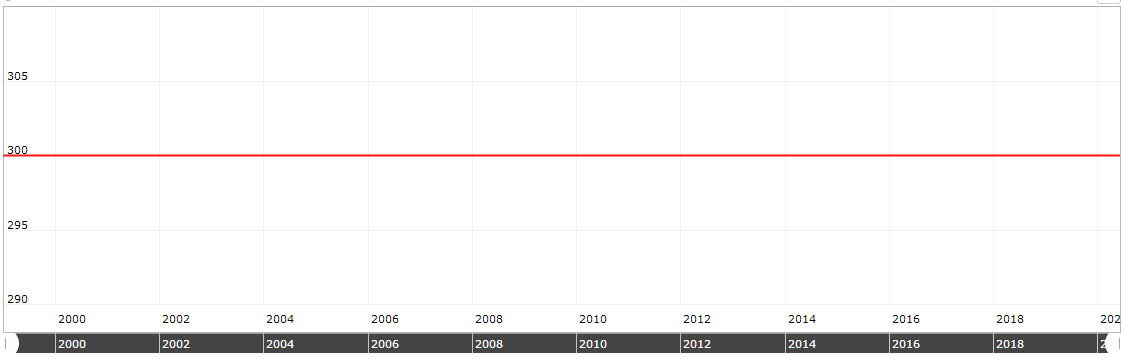
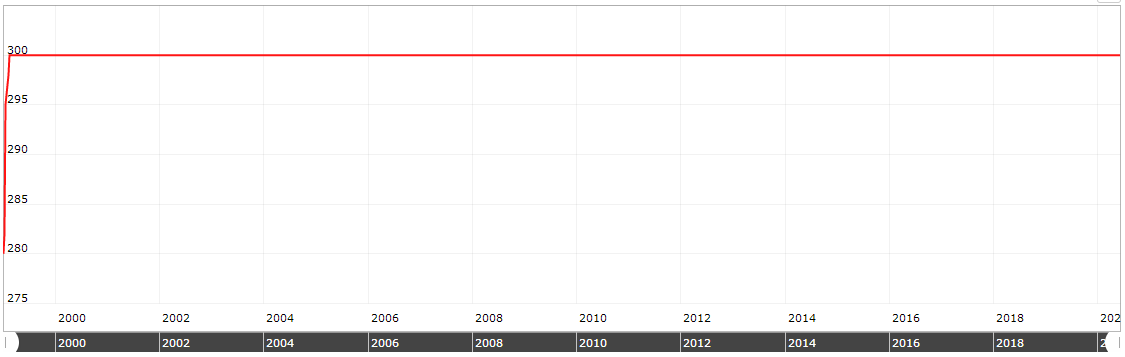
I’m sorry but I disagree while having the same data. Instead of looking at All Fundamentals - Canada, please look at my universe. Anyone living in Canada is familiar with the TSE 300, the predecessor to the S&P/TSX, which is the most followed index among Canadian professionnals.
You see both data providers are able to populate 300 large cap companies from 1999-2020 with no issue.
I verified randomly, in January 2000 ONLY 10 out of 300 companies are different between both providers.
Now if you come back to my EBITDA(0,TTM) charts, out of ALMOST the same companies, it takes Factset until 2008 to be able to calculate that line item for at least 270 companies, while S&P Global is able to do it right off the bat as of 1999. I understand your argument Factset is superior to S&P Global right now with more stocks and ETFs than S&P Global, but when it comes to historical data / point-in-time availability, it is becoming clear that S&P Global is superior, at least just for Canadian Equities.
Even if Factset got a bunch more of companies than S&P Global 20 years ago as you seem to imply, it’s useless for professionnals if they cannot invest in them because they are illiquid, or micro cap or with a bunch of NAs which is why I chose my universe for ranking purpose. If you look at the largest market caps as I did, it’s obvious which provider did more work manually inputting data in a database between 1999 and 2012.
As of today, maybe Factset got 20 analysts normalizing canadian companies financial statements while S&P Global only got 10. The issue here is that Factset had much fewer staff than S&P Global 10 years ago and it shows in the historical data availability. I know it might sound silly for many readers here to think of analysts “manually inputting” financial statements in a database but that’s really how they did it in the past, and that’s still how they do it for Canadian Equities today. I used to work for a company who had analysts who’s sole job was to take Edgar/Sedar filings and inputting one keystroke at a time each number for each company 8 hours per day every day, that’s completely nuts when you think about it! Now this “monkey’s job” is getting done with algorithms by pulling the numbers thru XBRL format… so it’s a software engineering job for US companies but this XBRL format is only voluntary in Canada yet… As long as it’s only voluntary you will have those analysts typing those numbers one by one for Canadian stocks…