SMA Yield

I’m trying to do something that seems simple enough but I need a little help.

Using the Fundamental Chart tool I was trying to add the SMA of a stocks div yield.

SMA(14,0,#Yield) or something like that was what I had in mind but it doesn’t work. What am I missing?

Thanks

#Yield isn’t a series, so that won’t work. The best bet may be to use something like;

LoopAvg("100*DivPaid(CTR,ANN)/MktCap",8)

Walter

PS Oops, that’s bad, too. You’ll need to calculate MktCap over time. Try something with share count * price.

DivPaid is taken straight from the cash-flow statement, and is all dividends paid across all share classes and preferred shares. (And includes payments to unconsolidated subsidiaries, I think. Not sure about that one.)

So you should be looking at IAD and share price. The problem is that those items move at different rates.

The IAD is likely to change either once a year or with every regular dividend. If it changes once a year, it’s because the company published a dividend schedule for the year. If it changes once per regular dividend then it’s because the market/we are using the standard estimation of (frequency of dividend)*(most recent regular dividend)=IAD.

So if you’re looking for the 14-day average of the dividend yield then we can approximate it with:

((IAD*(LoopSum("Close(CTR)",5)))+(FHist("IAD",1)*LoopSum("Close(CTR)",5,5))+(FHist("IAD",2)*LoopSum("Close(CTR)",4,10)))/14

There are two problems here: First, IAD will change at most once a week in this equation because we’re checking to see if it changes once per week. Furthermore, this will not take splits into account. (Both are limitations of FHist, a last-ditch effort to get data that isn’t available otherwise.)

Honestly, I think that this is probably better:

(Yield+FHist("Yield",1)+FHist("Yield",2))/3

It should be split immune, though it’s still not going to be immediately reactive.

I would also note that we offer Yield5YAvg, which is the five-year average dividend yield. Honestly, if you’re looking for “yield is better right now than historically” then I would lean toward using that instead of a shorter-term SMA. If your original thought was “SMA of the last 14 quarters” rather than “SMA of the last 14 days” then the 5-year average, already calculated, is going to be a lot less work than any “more accurate” approximation.

Thank you both Walter and Paul.

Using FHist was a great idea (I forgot about that one). I can get it to work quite well by doing and add and divide by weeks as suggested above by Paul.

However it makes for a long formula when creating more complex signals. For instance if I was creating a MACD of sorts then it looks like this:

((Yield+FHist("Yield",1)+FHist("Yield",2)+FHist("Yield",3)+FHist("Yield",4)+FHist("Yield",5)+FHist("Yield",6)+FHist("Yield",7)+FHist("Yield",8)+FHist("Yield",9)+FHist("Yield",10)+FHist("Yield",11))/12)-((Yield+FHist("Yield",1)+FHist("Yield",2)+FHist("Yield",3)+FHist("Yield",4)+FHist("Yield",5)+FHist("Yield",6)+FHist("Yield",7)+FHist("Yield",8)+FHist("Yield",9)+FHist("Yield",10)+FHist("Yield",11)+FHist("Yield",12)+FHist("Yield",13)+FHist("Yield",14)+FHist("Yield",15)+FHist("Yield",16)+FHist("Yield",17)+FHist("Yield",18)+FHist("Yield",19)+FHist("Yield",20)+FHist("Yield",21)+FHist("Yield",22)+FHist("Yield",23)+FHist("Yield",24)+FHist("Yield",25))/26)

I can’t seem to get LoopAvg to work though. Am I doing something wrong?

LoopAvg("FHist("Yield",CTR)",12)-LoopAvg("FHist("Yield",CTR)",26)

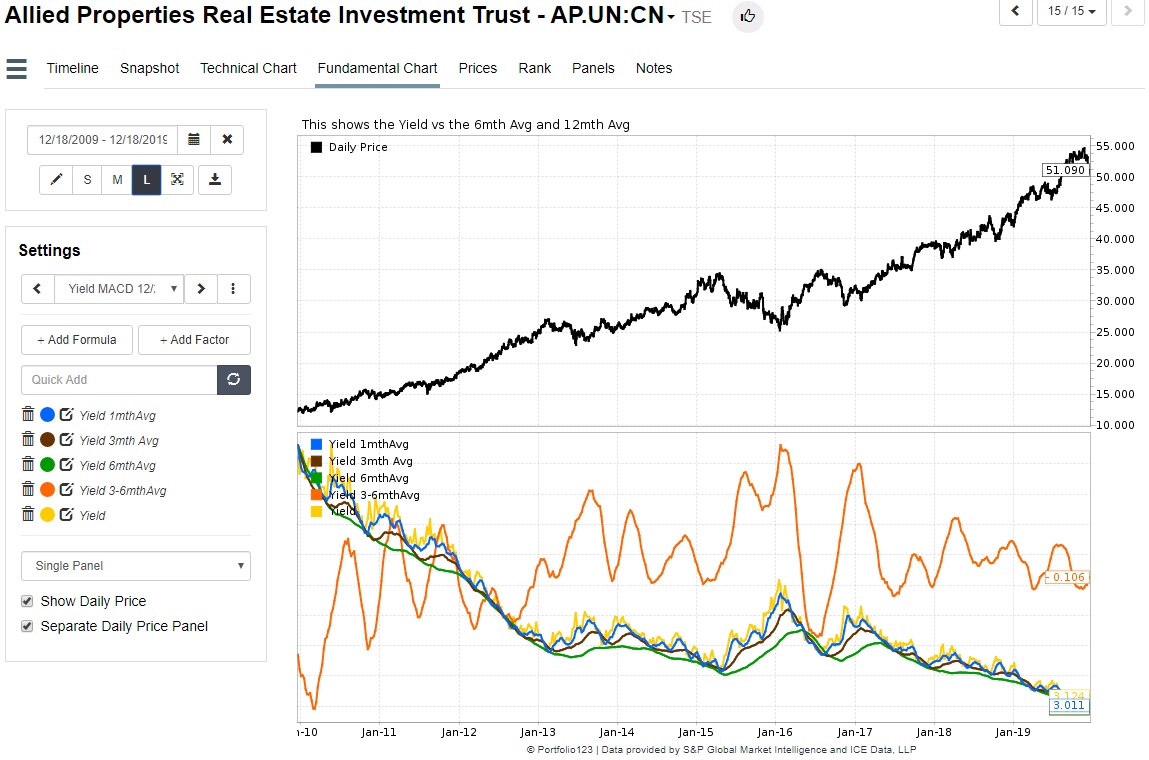
By the way it would be really nice if Fundamental Charts had an interactive vertical value line so we could scroll though the timeline with better accuracy. The grid lines just aren’t enough IMO.

Also it would be great if we could turn factors on and off in the list. It can get pretty messy when doing a study and I hate deleting formulas that you may want to add back in.

The LoopAvg doesn’t work b/c of the quoted string within a quoted string issue.

Also, Yield is the one year forward (projected) yield and is based on the IAD. Since the indicated annual dividend changes infrequently, taking the average over several weeks really reflects the stock’s price movement, if that’s what you’re shooting for.

Great idea. Also increase the chart resolution to daily.

That’s been proposed as a Feature Request, but never got anywhere.

Walter

LoopAvg requires a data point that uses parameters. So you could use it with Sales(0,TTM), varying the 0 from 0-20, but not SalesTTM. Yield as a factor never varies on a given as-of date, so it’s “working,” taking the average of Yield*26/26.

Yield only comes as a factor, and even the underlying calculation of it (100*IAD/Close(0)) involves a factor. Like I said, it ultimately becomes easier to use Yield5YAvg. Most dividend strategies, in my experience, tend toward the long term anyway.

I figured that was the issue but I wanted to check and make sure.

With price movement was the idea. This was just an experiment to see if I could find some pattern to give a bit more of an edge to knowing what is and isn’t historically expensive when buying well established dividend paying companies. Many of them seem to maintain a fairly consistent yield and I was hoping the historic yield would give me an entry/exit point advantage if the yield would revert to mean. REIT’s and banks were the focus group in this case. Below is just an example and the MACD type indicator shows a pattern that might have something to it. Time will tell.