Hi,
got some messages from P123 Comunity regarding my ranking system.
I used to trade only value and stock momentum but added quality and industry momentum:
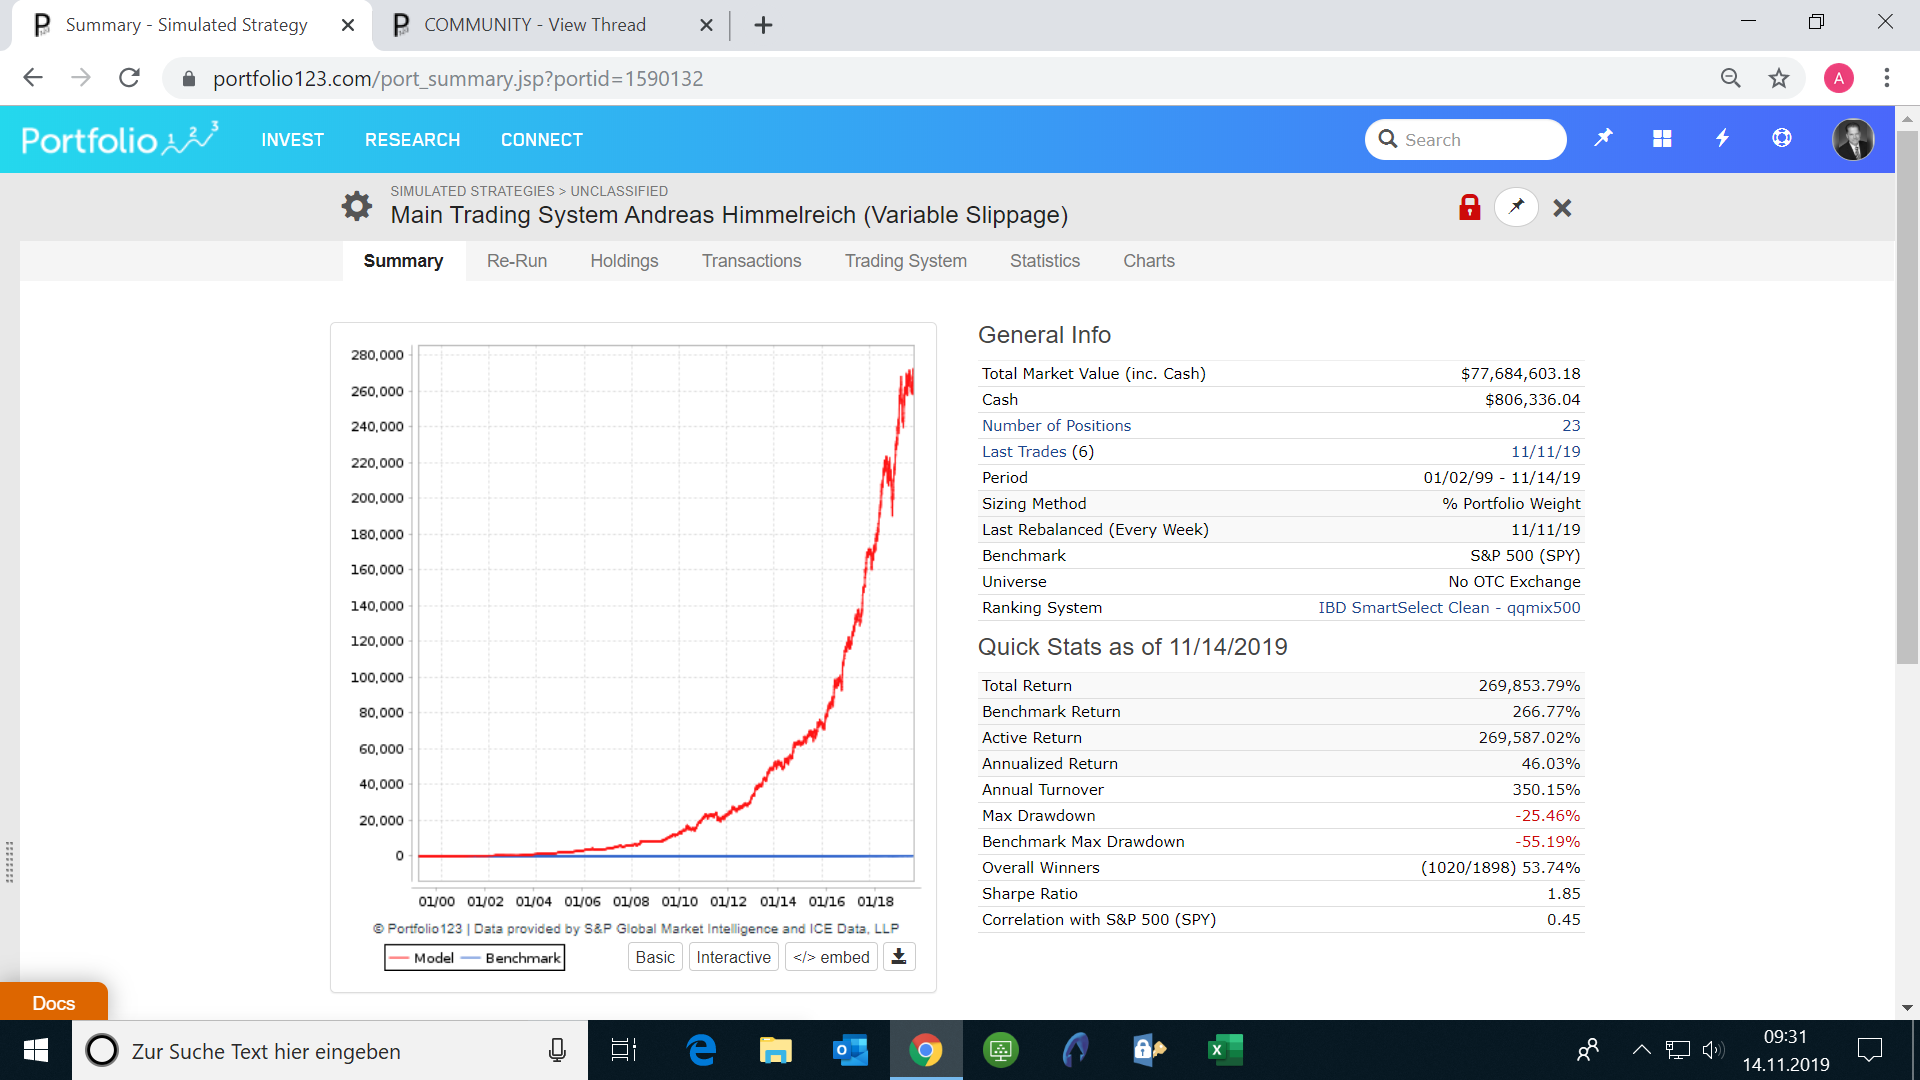
Here the backtest of my improved system. Thank you all @p123 (staff and users!) you helped my a ton!!!
This Backtest is with variable slippage and with the average of high and low at the trading day (not last close or next open!)
it also trades as good at next days close!
Was able to go higher in market cap and even added performance at the same time.
Since my account is growing, I could not trade the nano caps anymore, to much price impact and slippage, so I am
really glad I could climb the market cap up!
Judgetrade - that is a pretty impressive simulation you’ve got going there!
I have one observation on your ranking system. The growth node EPS%ChgPYQ is probably not doing what you think it is doing. Stocks with small PYQ EPS i.e. close to zero, either negative or positive, will dominate other stocks for this factor. If a company has a seasonally weak quarter, that quarter will be amplified relative to the rest of the year. For example, a company that produces Octoberfest beer would rank very high or very low in the spring when its sales/profits are limited. This is simply because the divisor in the growth formula (quarterly EPS) is close to zero, hence the resulting node will be either very high and close to infinity, or very low and close to (negative) infinity.
On the other hand, this growth factor will emphasize stocks that are going from no earnings to positive earnings from year ago quarter, if that is the objective. But I don’t think you would want to make that judgment on a single quarter. Perhaps the second factor in your growth section will help in that regard, I’m not sure.
There are a couple of bugs: ROEttm/ROEq and GrMgnttm/GrMgnQ. Becasue each ratio deals with items that might be negative, you risk getting answers that are 180 degrees wrong. I suggest you use the (a-b)/abs(b) formulation rather than a/b.
Aside from that, I’d say your quality exposure is very modest. Given the impact of seasonality, the Q vs TTM comparisons are not bona fide growth at all but a variation on momentum; specifically, these are trading on the price impact of inappropriate algorithms (which, in this day and age with all the money moving around based on algorithms that may or may not be fundamentally sound, can be a real thing — in a market with so many large players, might can make right).
The same holds true for Steve’s observation re: EPSpyq. It is often a very bouncy number for reasons he summarized. But then, again, there are trading opportunities to be had if enough players make the same fundamentally “wrong” decision at the same time.
There is a body of thought (behavioral finance) that looks to psychological factors rather than financial or statistical factors. What you have here is a variation of that I’ve been noticing — investing based on the behavior/emotions of machines and those who program them. I started to think about this a few years ago, when I noticed that adjusting for nonrecurring items seems to be less beneficial than it was in the pre-machine days. Fundamentally, you MUST make these adjustments since historic data is useful only to the extent one thinks it can persist into the future, but when non-recurring items are involved, we know with 100% certainty that these can’t persist. Or at least we humans who understand security analysis know that. Machines don’t know it and neither do many who develop algorithms and trade on them. And again, if enogh money moves a certain way at the same time, might make right. The same can be said for the Q vs TTM items. And as I type, it occurs to me it would be interesting to even test a/b versus (a-b)/abs(b).
In any case, one way or another we’re dealing with some version of momentum, which notes what the market is doing and presumes it will continue doing it — and hope we can notice a change in behavior before it becomes manifest in price action. Quality is the opposite — we’re looking for what’s substantive and has a high probability of persistence. Often this is more risk reducing than return generating.
I have been thinking a lot about this issue for a while. The %growth is convenient because the % can be comparable between stocks. Instead of using %growth, you could try to use the change in % earnings margin. You could use something like this:
100*(EBITDAQ/SalesQ) - 100*(EBITDAPYQ/SalesPYQ)
The 100* is not necessary for the ranking factor of course. I put it there so the calculation is recognized as a percentage.
Or you could use one of the built-in margins calculated by P123 such as;
NPMgn%Q - NPMgn%PYQ
This will keep the result as a % and comparable between stock while still addressing the desired parameter, that being Y-o-Y quarterly change. I haven’t tried these suggestions, they are straight out of my imagination. If this idea looks good to you then let me/us know.
We need to start being more cautious about how the design of factors, particularly with regards to what goes in the denominator. The value fish are not jumping into our fishing boats like they used to.
Andrea has kindy given us a RS (I do not know if is complete or not, because he says “I used to trade only value and stock momentum but added quality and industry momentum” ; here I see only industry momentum, quality and growth, but value and stock momentum seems missing and above all we do not know the weight of each peace; Andrea could you pls tell is if the RS is complete or not?
Anyway you are comparing a RS with a Simulation, and we do not know Andreas Buy/Sell rules…I wish I had such a Sim
After further review, the performance curve would indicate a much lower annualized return of about 30% from 2014 onward. Andreas can you please post the performance from Jan-1-2014 of this model to verify this.
Hi Steve,
EPS%ChgPYQ
“On the other hand, this growth factor will emphasize stocks that are going from no earnings to positive earnings from year ago quarter, if that is the objective.”
Yes, that is the objective!
Hi Marc Gerstein,
I do not understand your (a-b)/abs(b) formulation, sorry but my math is terrible. Could you give me the exact formula I should use?
That would be great, Thank you!!!
Further:
“What you have here is a variation of that I’ve been noticing — investing based on the behavior/emotions of machines and those who program them.”
That is kind of the Idea of all my models. As Quants, at least this is my definition, we hack emotions of others especially in turnaround situations where the second derivative (e.g. rate of change) happens and market participants need to catch up (and try to be faster then the others).
E.g. I do not care so much about earnings, but for example the very recent rate of change earnings.
I tested longer term “standard Qualtiy stuff” (like 5 Year earnings consistency), but got ridd of it a bc. Rate of change (“fundamental momentum”) seems to give better results.
The thing is, I think I can explain that by emotions of market participants emotions (my assumption could be wrong), that chase that fundamental momentum (which is kind of backed by academic papers), so I give it a try. I know that is risky, bc. I do not have a 100% or even 50% knowledge about market participant emotions, but my “intuition” tells me, it’s worth the risk.
I would still define it as quality, but in rate of change terms, but you are right its kind my own definition.
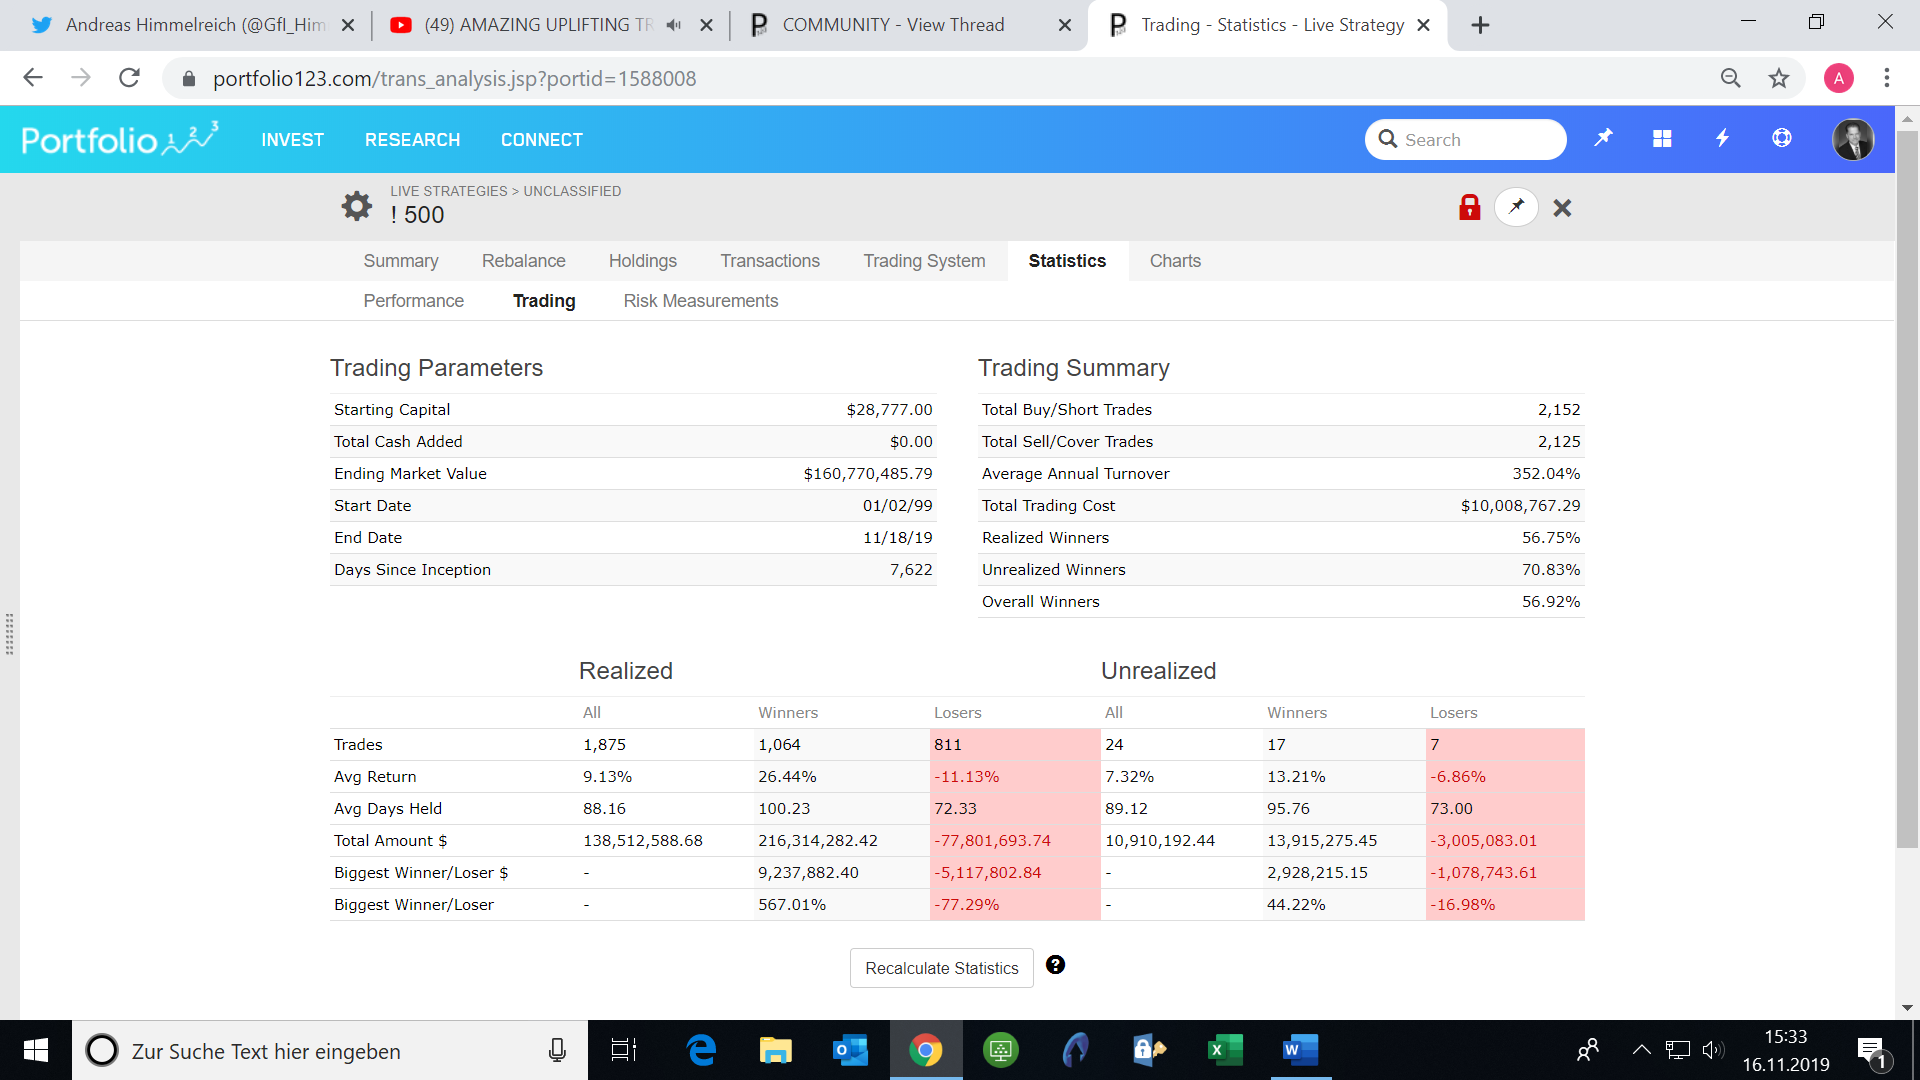
The settings are 0.01 per Stock transactions costs (that’s what tradestations charges) and
The standard “variable” slippage calculation, which I can (not always with every stock and every day) beat slightly in my actual trading with tradestation.
BUT IT DOES NOT SCALE!
It scales up to a 3 Million Portfolio Value assuming the following formula BuyAmount/Price < 0.10*AvgVol(20). [I know even that is a stretch, so 5% of the volume would meand 1.5 Million Port Size) After that I am dead in the water and need to go to higher volume stocks.
But I do not care, small size of my port (around 820k) is a big competitive advantage in terms of that I capture the size premium.
Hi philjoe,
I assume a much higher (50%?) future DD. I have market timing (combining 75 MA of the SP500 and the earnings trend of the SP500) in the model that might not work in the future.
Best Regards
Andreas
Hi Walter,
Yes, this is only a part of the ranking system I am using.
Thank you,
Best Regards
Andreas
P.S. Still plan to visit in Wiesbaden, got to much on my plate right know, but I keep you posted
Hi Steve,
Thank you!!!
I tried 100*(EBITDAQ/SalesQ) - 100*(EBITDAPYQ/SalesPYQ)
Better in recent years, but slightly worse then EPS%ChgPYQ
I also tried
NPMgn%Q - NPMgn%PYQ
Almost the same result as EPS%ChgPYQ, but a bit higher drawdown
Best Regards
Andreas