I ran a decision tree of the designer models to see what has been working.
For:
-
all models with data for 2 year excess returns
-
the features for the tree were Momentum (m), Value (v), Quality (q).
-
Two classes: 1) those that had excess returns above the median or above and 2) those with excess returns at or below the median.
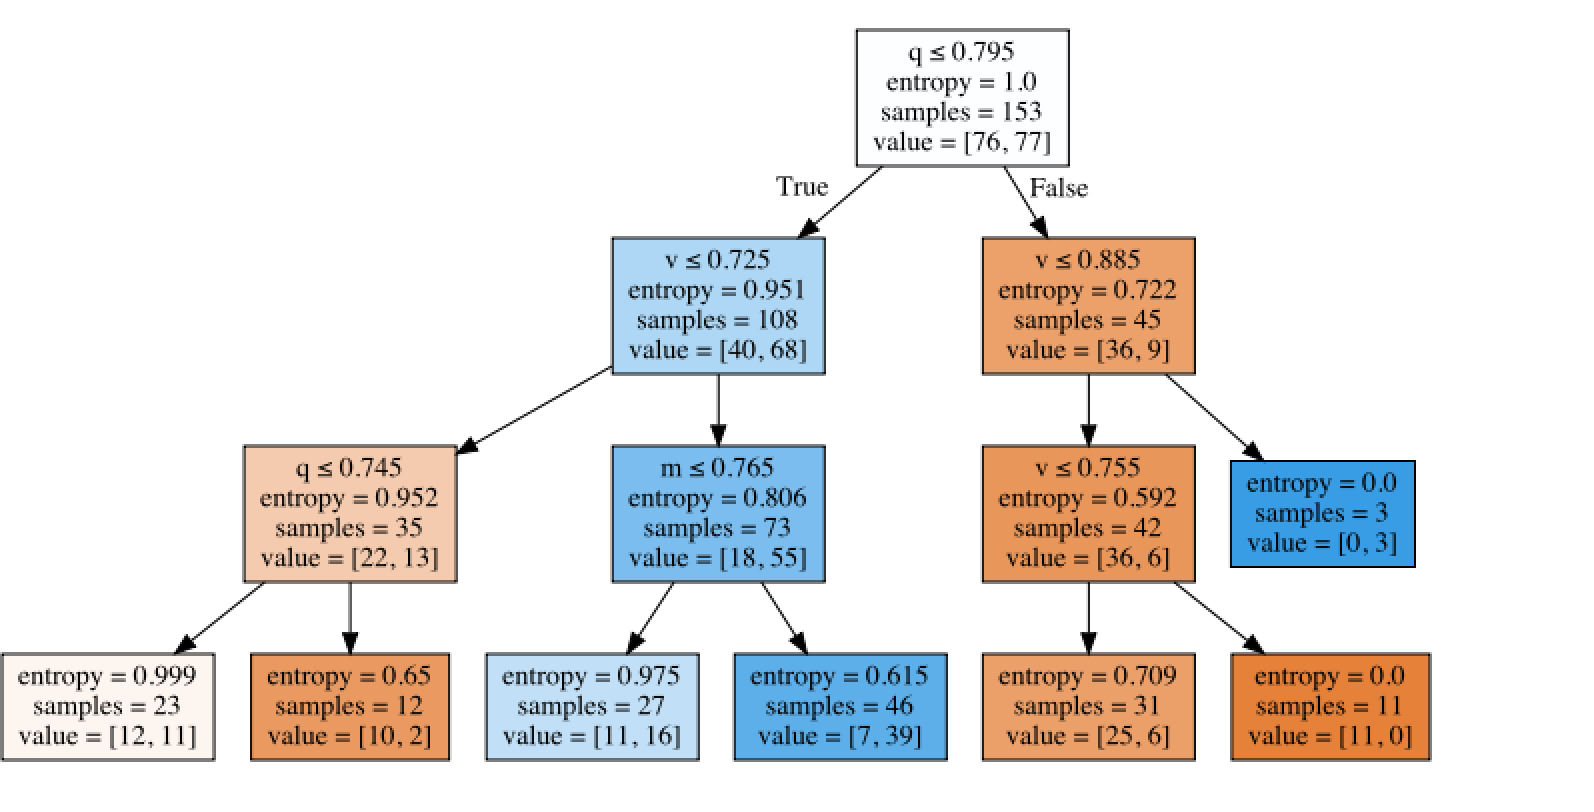
Notes for those new to decision trees. Entropy of 1 means there is an equal mix (e.g., first node near 50/50 split above and below median). Entropy away from median means the tree is doing its job: finding good and bad models (splits that separate the good and the bad). But you can just look at “Value” not to be confused with a value factor.
Value[x,y] x is number of models in the node at or above the median. Y is below the median.
The first split in the diagram splits q (Quality) splitting above and below 0.795 (the P123 value factor). The other nodes are labelled similarly.
THE TREE WILL SPLIT THE MOST IMPORTANT FACTORS FIRST.
Conclusion:
Quality matters in todays market: quality is the first split (the most important split) creating a node with 36 models above the median and only 9 below the median (pretty good).
Value for the right split is more complex and any takeaways may be overfitting—something decision tree tend to do. But maybe there is something useful. Maybe one could argue that for high quality models there is a “goldilocks” situation where you can get the value just right and end up with the terminal node (leaf) at the bottom right.
Momentum is the least important factor.
BTW, if one used a walk-forward validation one might mitigate the problems of overfitting AND keep up with any trends (or cyclical behavior of the markets).
[color=firebrick]Would it be a mistake to fund 3 lower-priced Designer Models in a perfect leaf (zero entropy) each month? [/color]Or maybe the 3 best performing models in a perfect (zero entropy) leaf. Let me be the first to say that there are probably better algorithms than that but I am not sure that that is a bad strategy either.
If anyone wanted to implement some of this, a more complete download of data would be helpful—e.g., weekly data on the Designer models. Not just one- or two-year excess returns. I am not really asking for this, as my focus is elsewhere now, but it is an illustration of how more would be possible with expanded (FactSet approved) downloads or better integration of Python with P123. Or ultimately, an API.
-Jim