I noticed some seemingly unwarranted differences when an ETF-based strategy holds a position that is identical to its ETF-based benchmark when they are running simultaneously and even without any trades. I’m wondering if anyone can tell me the reason this might happen? It’s probably too obvious and I’m overthinking this, but it’s not clear to me what could cause it.
This particular model trades between the S&P 500 Equal Weight ETF (RSP) and the 20-Year Treasury ETF (TLT) based on a composite of a dozen macroeconomic, technical, and fundamental factors to determine when the market risk has increased sufficiently to justify a switch to TLT. The model uses the S&P 500 Equal Weight ETF (RSP) as its benchmark to make an obvious comparison of clear outperformance that results from relying on the timing algorithms as compared to passive, buy-and-hold of RSP.
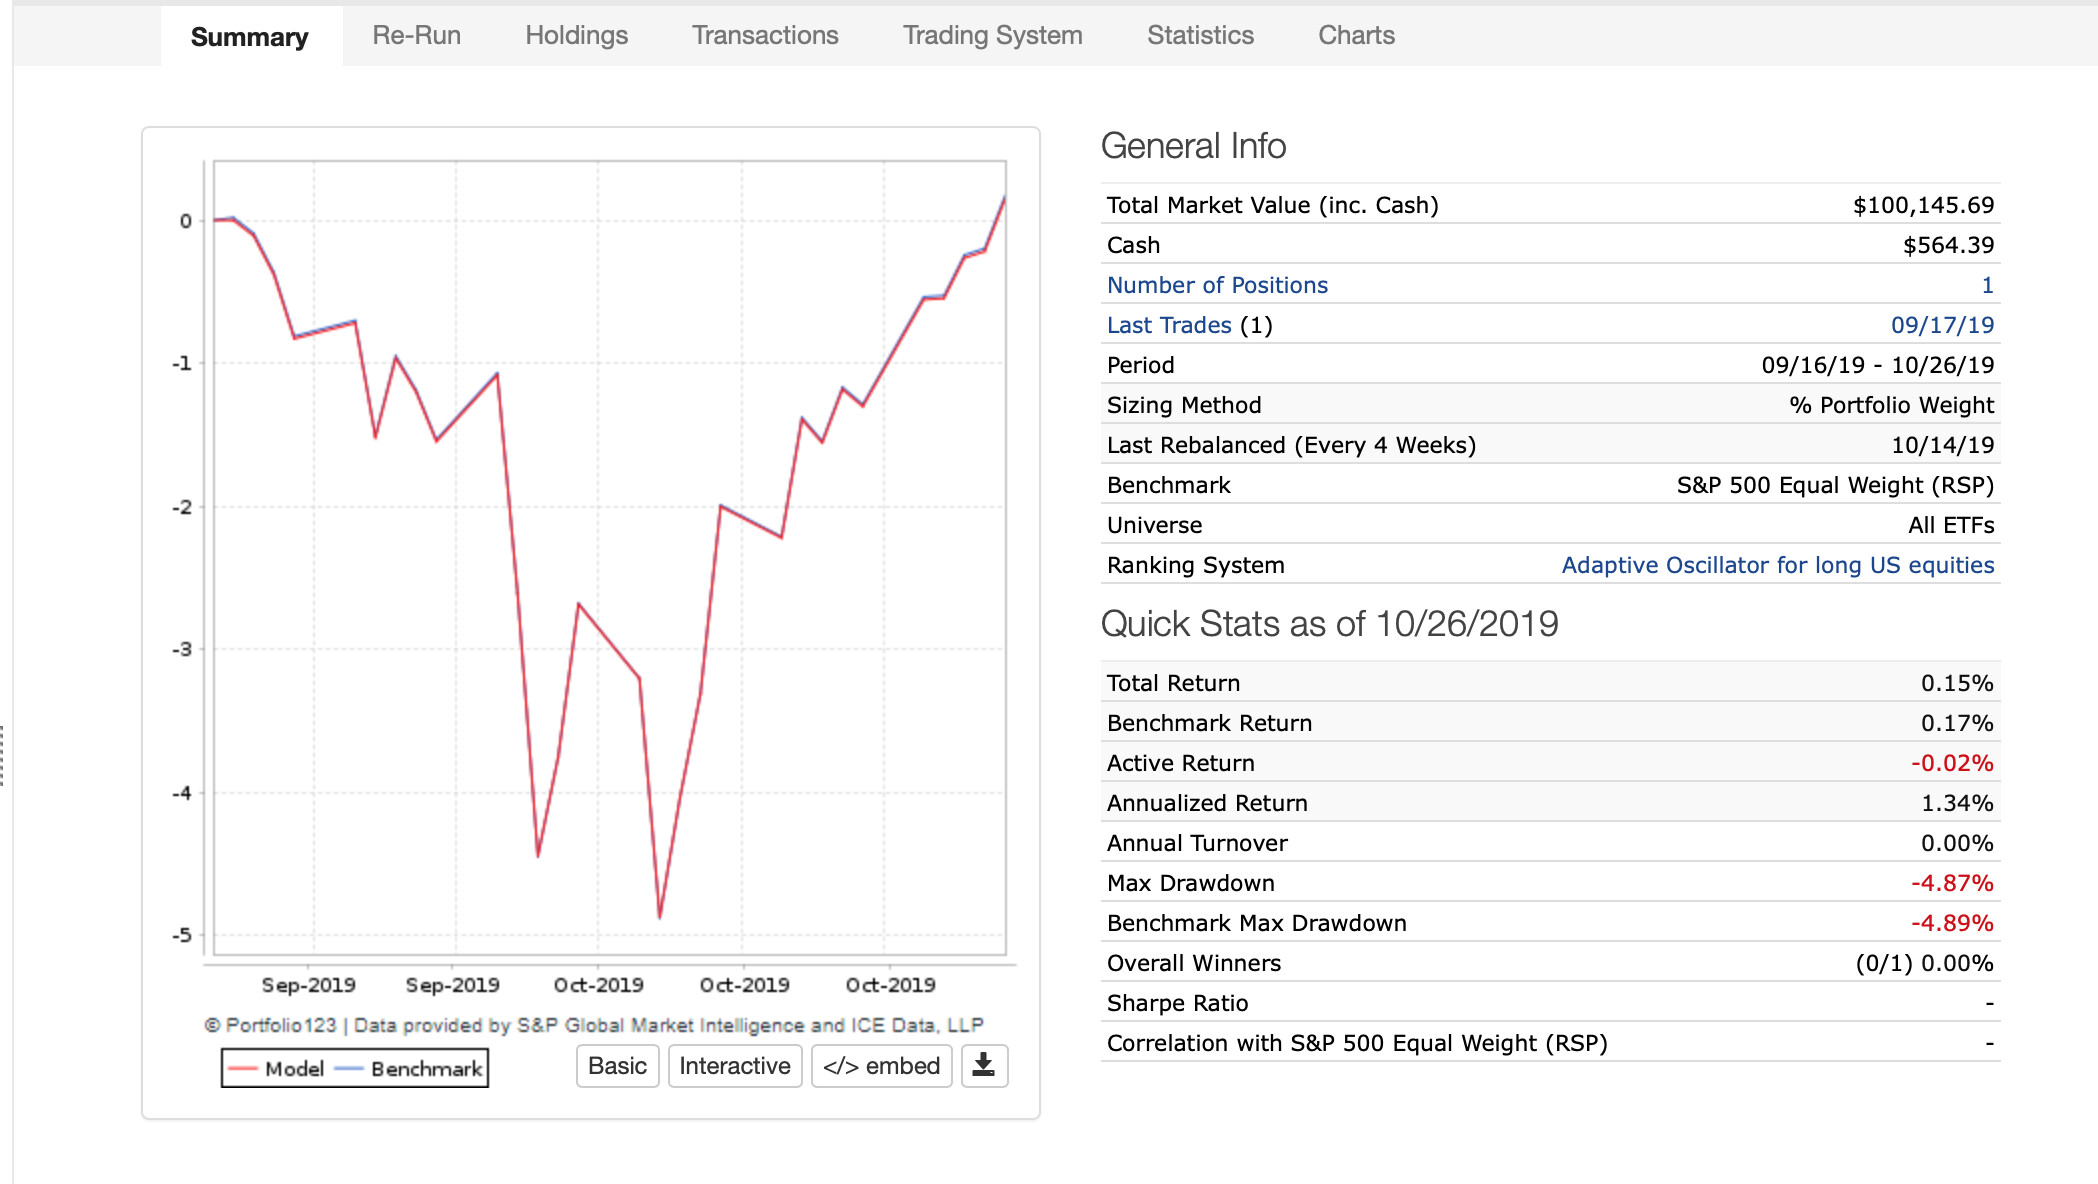
For a specific example of what I’m referring to, I focused on the last time this model traded to RSP (September 15). There are no trades, so both the model and its identical benchmark began running simultaneously on Sept. 15:
As you can see, the total return over about 30 trading days is 0.35% for the strategy (holding RSP) and 0.24% for the benchmark (also RSP). While it may seem insignificant with those small performance numbers, it’s actually a 45.8% difference!
This 30-day timeframe included a -4.89% drawdown and recovery back to slightly above breakeven. For an apples-to-apples comparison, both commissions and slippage are set to 0%.
If both the model and the benchmark are simultaneously represented by the S&P 500 Equal Weight ETF (RSP), why would there be a 45% difference in performance between the two? Thanks!
Thank you for the reply, gentlemen. However, I’m not clear on how either of those reasons could cause a discrepancy,
I always use “Next average of high and low” for pricing of ETFs, since they should always be purchased away from the opening and close as a best practice.
If the ETF held In the model and the benchmark ETF is the same ETF (SPY), why would the dividends be different?
Are you asking why there is a difference or telling us what the best practice is: “………since they should always be purchased away from the opening and close as a best practice.”
If it is the former I did the following to shed light on why and I got the image below:
changed the start date (see image).
Moved purchases to next close (yes next close and not previous close—I double checked).
I guess one could still wonder what is going on with the start date but I doubt that it is a potential concern beyond the start of a sim (whatever causes that).
Anyway, looks like Marco had the answer from the beginning.
Thank you for the input, and I apologize for not being clear. I was making a statement that it is generally accepted wisdom that the appropriate time of day to purchase ETFs is mid-day – definitely not near the open or the close, for the reasons outlined here.
However, my question for Marco (or anyone who knows): Is there a reason that the Closing Price is used for the benchmark ETF – or any benchmark, for that matter – in Simulations? Since we are using this formula for prices on live trades:
((Close X 2)+High+Low) ÷ 4
…wouldn’t it be better to use the average of the high and low (or something similar) as pricing for the benchmark? It seems this would be the best apples-to-apples comparison between a strategy and its benchmark, considering the price used for the model positions. Or do I have it wrong?
Chris
Also, I wonder how dividends are handled differently between a model that’s holding SPY and a benchmark that is SPY?
I am not 100% sure on this…so take it for what it might be…
Your simulation with the ETF has a cash balance. That is from dividends being paid into your account. The cash is currently just ‘sitting there’. So this will provide a tiny cushion for your portfolio when ETF prices fall and a slight drag when ETF prices go up.
Some benchmarks are not ‘total return’ benchmarks. Yours will be total return since you either re-invest your dividends or you hold it as cash and this is reflected in your portfolio value.
The date that you re-invest your dividends matter a lot due to difference in ETF prices. This too will create tracking error between your live portfolio and the ETF.
ETFs have tracking error from their benchmarks due to small differences in how real cash is managed versus theoretical perfection. How you manage your portfolio here in P123 has tiny differences than how the ETF is managed so I would assume there to also be some tracking error.
Perhaps Marco will address this question since it sort of is important to the overall use-of and comparison-to benchmarks across the P123 platform. I’m sure there were decisions made at the beginning and at critical revision points about the ‘best practices’ for many of these issues, and in many cases, compromises had to be made. I’m just hoping to learn the why’s for the standards used for benchmarks, and perhaps enable more effective use of the platform.
I’m sure there was a good reason to use closing prices for benchmarks. However, if it happened to be a random choice and the other price sets (benchmark open, avg. of benchmark high/low) are available, I wonder if it’s possible to make them available as a choice – just as they are available for our model’s stocks/ETFs?
As I mentioned previously, it seems that the average of high and low would be the most logical series for benchmarks because it coincides most closely with the opening/and closing prices used in live portfolios. And aren’t our simulations intended to be close estimations of what we obtain in real-time, OOS investing?