Hi all!!
I need little help with my last sim, I tried to buy within 10% to 15% of a 52-week low, and if possible, that the stock has shown itself to offer some price support.
Anybody has any idea how I can do this?
Thanks!!!
Hi all!!
I need little help with my last sim, I tried to buy within 10% to 15% of a 52-week low, and if possible, that the stock has shown itself to offer some price support.
Anybody has any idea how I can do this?
Thanks!!!
Well, the first part is Price/PriceL < 1.1 or Price/PriceL < 1.15. I don’t know what you mean by the second part, though. I thought price supports were government subsidies, so I don’t see how a stock can “show itself to offer some price support.”
Hello Yuval!! Thanks for your help!!
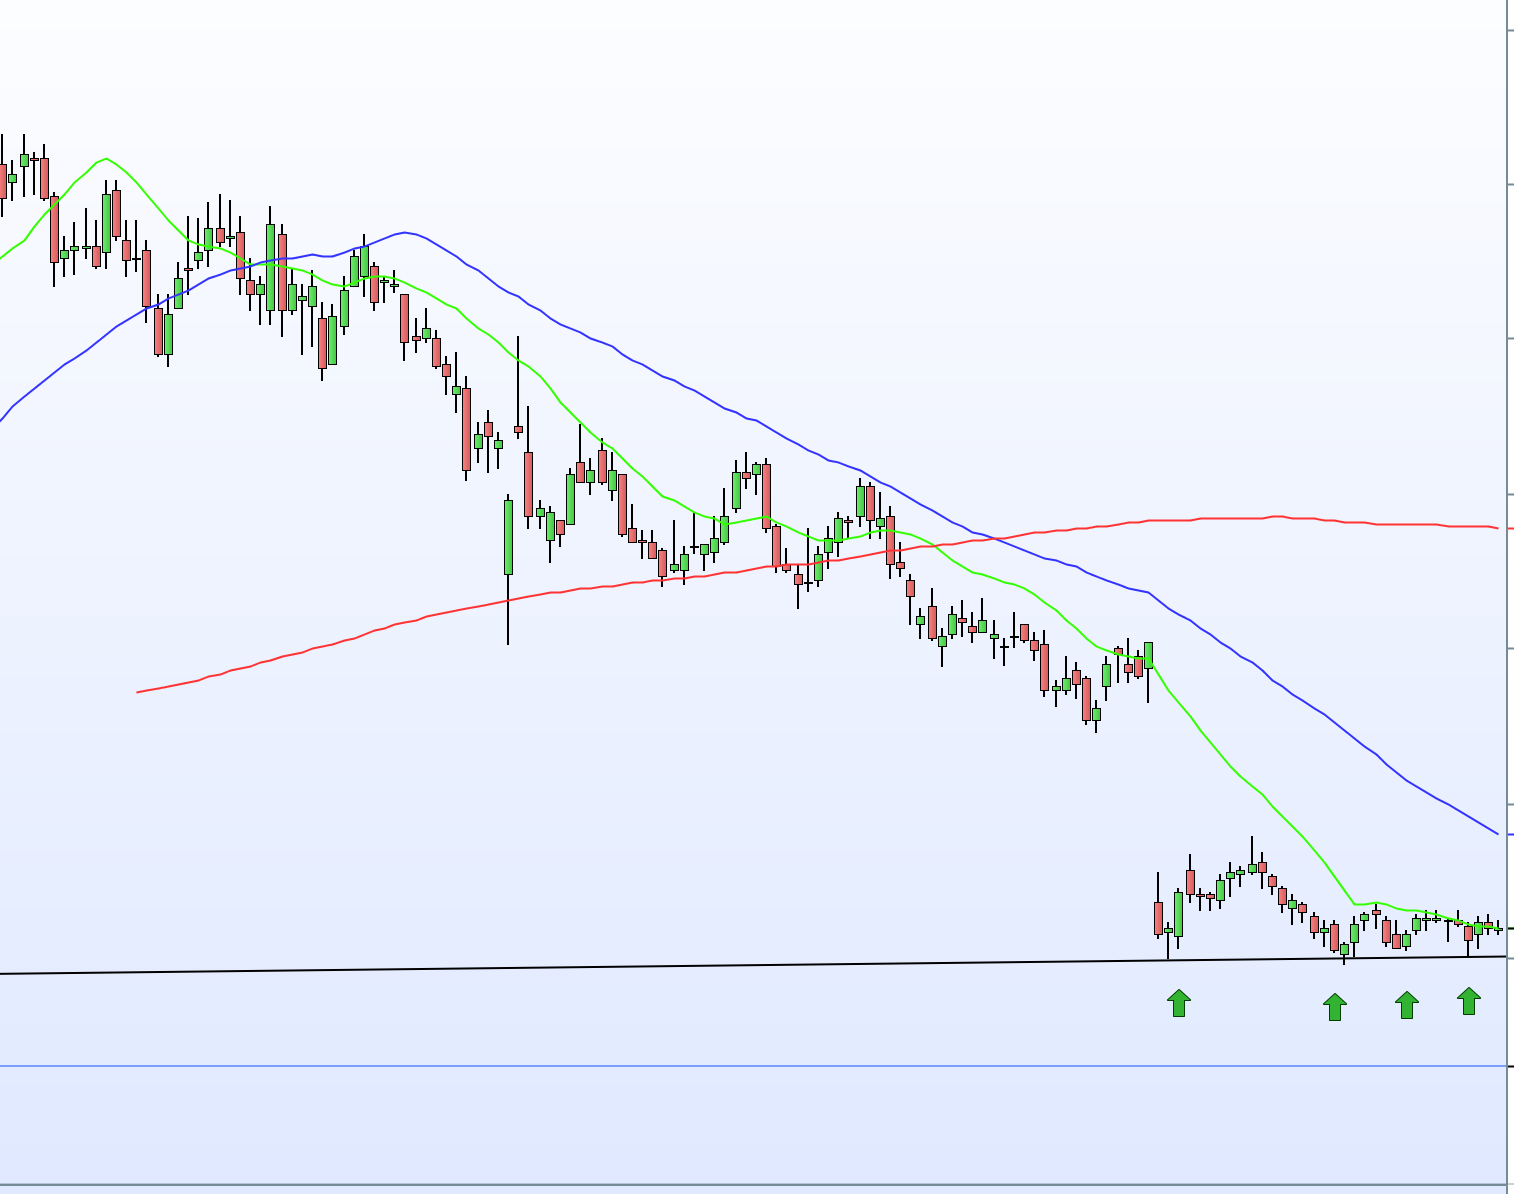
What I mean about “show some price support” it’s when the price don’t go down further a certain point and does it several times. For instance like the picture I attache here.
I do not know how to say this in P123, I think I can’t, but I’m not sure…
Translating visual chart patterns into code, even p123’s version of code, is always something of an art. If you’re dealing with support (or resistance), you should explore the Price Highest/Lowest group of factors.
You may, for example, want to do something like:
Close(0) >= LowValBar(5)
Close(0) >= LowValBar(10,5)
Close(0) >= LowValBar(10,15)
LowValBar(5)>=LowValBar(10,5)
LowValBar(10,5)>=(LowValBar(10,15)
Etc.
You can also work with resistance by referencing HighValBar
You don’t absolutely positively have to count bars. You can specify a period instead if you use LowVal or HighVal. I think LowVal(5) means 5 days; not sure, though since bars is the usual way of counting this sort of thing.
These functions are most natural for screening/buy rules. For ranking, you may want to set them up as booleans.
I will try, thanks a lot for your help Marc.