I’m hoping someone can offer feedback that will help me understand the P123 High-Yield (##CORPJNK) Corporate Bond data series.
I am trying to create a Custom Series that compares High-Yield Bonds (##CORPJNK) to the yield data of higher-quality corporate bonds, such as ##CORPAAA or ##CORPBBB. The problem comes from what appears to be an incomplete data set for CCC Bonds – but (strangely) it depends on how you are trying to view it. For simplicity, I’ll just focus on the problematic component of High Yield Corporate Bonds (##CORPJNK).
If I run a MultiChart for ##CORPJNK (the identifier for CCC-rated bonds) from 1996 (when the data begins) to present, I get this chart:
High Yield Corporate Bonds, 1996-2019
As you can see, the data stops in 2011. While disappointing, that’s something I can comprehend, as P123 has other data sets that are incomplete. If I change the timeframe from Maximum to 10 years, I get this chart:
High Yield Corporate Bonds, 10 Years
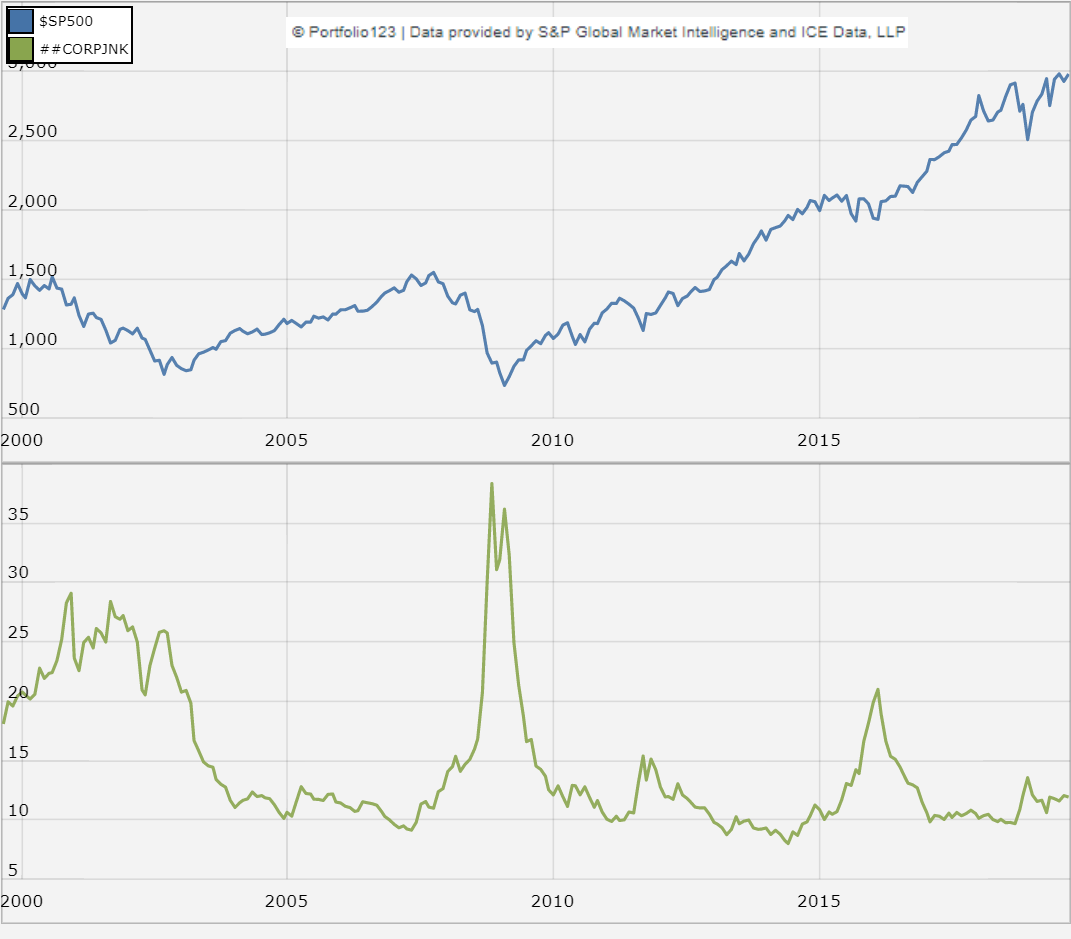
This is reasonable also, as this chart also shows the data ending in 2011. However, it’s not that simple! If I simply click the 5-Y button for this series in MacroCharts, I get this graph:
High Yield Corporate Bonds, 5 Years
It appears that the data set resumes if we look at a period closer to the present. I also tried manually inputting a start date, and a chart will appear with more recent data only beginning around May 1, 2014.
Does anyone have ideas about what is happening here?
Is there an alternative P123 data set that can be used as a substitute for ##CORPJNK (corporate junk bonds)?
Thanks for the quick attention to this issue. I think I may have figured out what was causing the problem.
I went back and created a new MultiChart, added a plot, chose “Economic Indicator” and selected " Merrill Lynch US High Yield CCC or Below Effective Yield" (i.e., ##CORPJNK) then selected “20Y” as the timeframe, I got the same chart – ending in 2011.
Then I started searching for something that might cause this problem. I went into the settings for that plot and changed the “Transform” from PIT to “Raw” – and the chart does fill out completely through present-day. So (apparently) this data is not PIT??
Nevertheless, I can see the Multichart correctly now. However, when I tried to run a series on the same data set (##CORPJNK), I’m getting this error:
[color=red]ERROR: In Rule 1: Error near ‘##CORPJNK’: Invalid command ‘##CORPJNK’[/color]
I am using the following rule: UnivAvg(“TRUE”,“Close(0,##CORPJNK)”). Am I doing something incorrectly?
##CORPJNK is not an available time series that can be used in functions.
Check what is available in “Factor & Function Reference” > “TIME SERIES IDs” > “Macro - Interest (FRED)”
Thanks for the tip, Georg. It’s unfortunate that some of the Economic Indicators in MultiCharts are not available for use in our systems.
I’m wondering if anyone has come up with a creative substitute for this series? Off P123, I find that the slope of the differentiation between CCC-rated bonds and AAA-rated bonds is an excellent signal for increased market risk.
And I’m very much looking forward to the coming P123 capability that will allow us to use our own series, which would solve this and many other issues.
Try comparing ##CORPAAA with either ##CORPBBB or ##CORPB. Those give a good signal for me when combined with other tests. I don’t use the slope of the difference so your results might not be directly comparable.
I also look forward to using them in some way in model rules rather than checking separately.
Yes, I am using COPRPAAA and CORPBBB as I mentioned previously.
I also know from comparing (off P123) the High-Yield series with the Investment-Grade series that it could be great if it could be used in P123. As I mentioned earlier, it will be great when the new feature that allows us to use our own series is ready for use. I’ve got a long list of data sets ready to be put to use!
There was an issue with the PIT transformation code that has just been resolved which was causing the ##CORPJNK series rendering to malfunction at 2011-03-31 because values for multiple dates were recorded on that date; it was only an issue if plotting started before that date.
To explain the difference between Raw and PIT:
The Raw transform yields the revised series with the observation date being the end of the date range (zooming does not affect this).
The PIT transform yields the most recent value for the latest date on or before each date in the date range. That is, it is effectively functioning as an ‘As Reported’ transform.
All other transforms yield values derived from the Raw transform.
I just saw your response to this issue from September. Thank you for resolving the problems between PIT and Transform for CORPJNK, and explaining the differences between the two data sets.
However, I am wondering if there is a way to make this data series available for use in Custom Series? I have found the CCC data, compared to other data sets (with a slight offset) can provide an excellent risk mitigation approach.
If the other data sets are available in both Multi-charts and CustomSseries for AAA and BBB, etc., and the CCC data is available for use in Multi-Charts, it seems like this would be fairly easy to enable. If not, please clarify. Thank you.