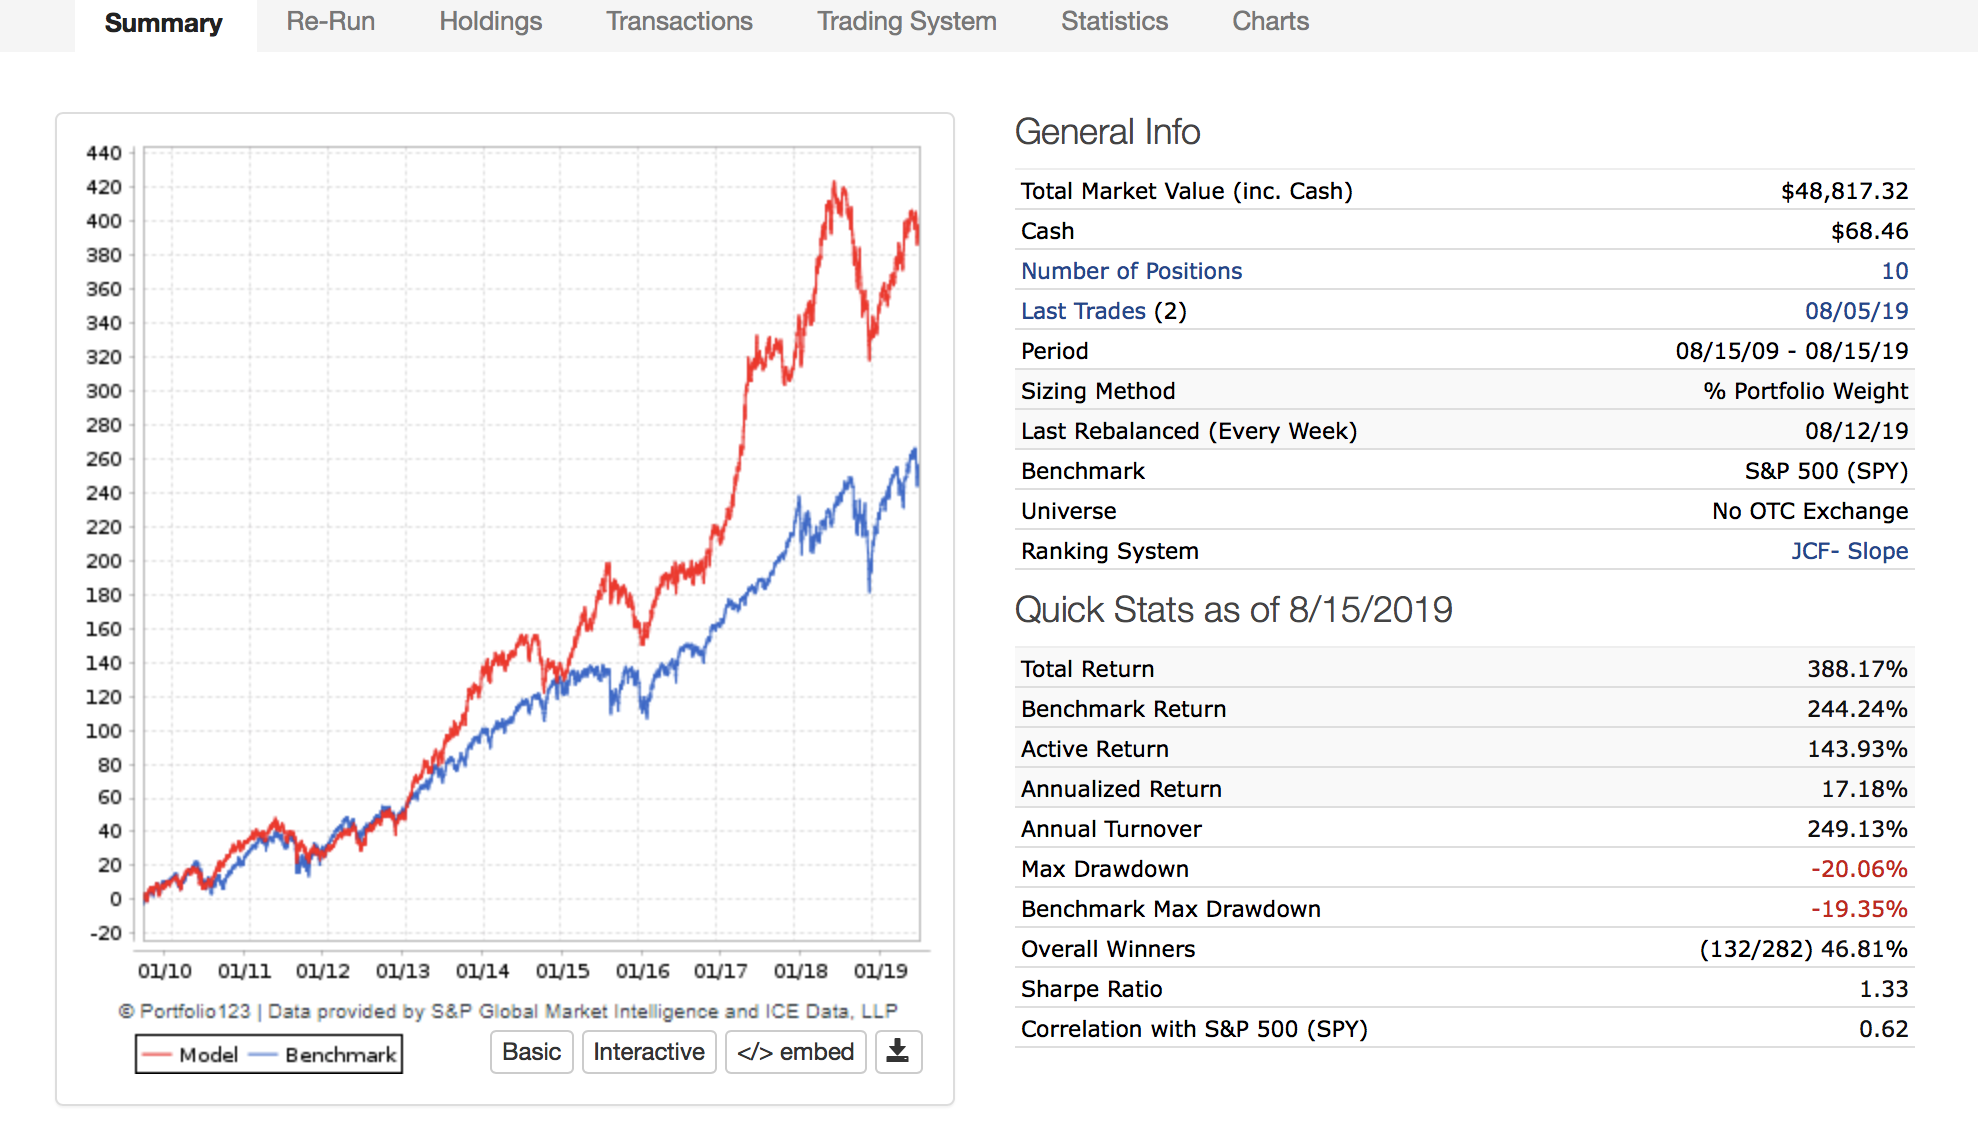
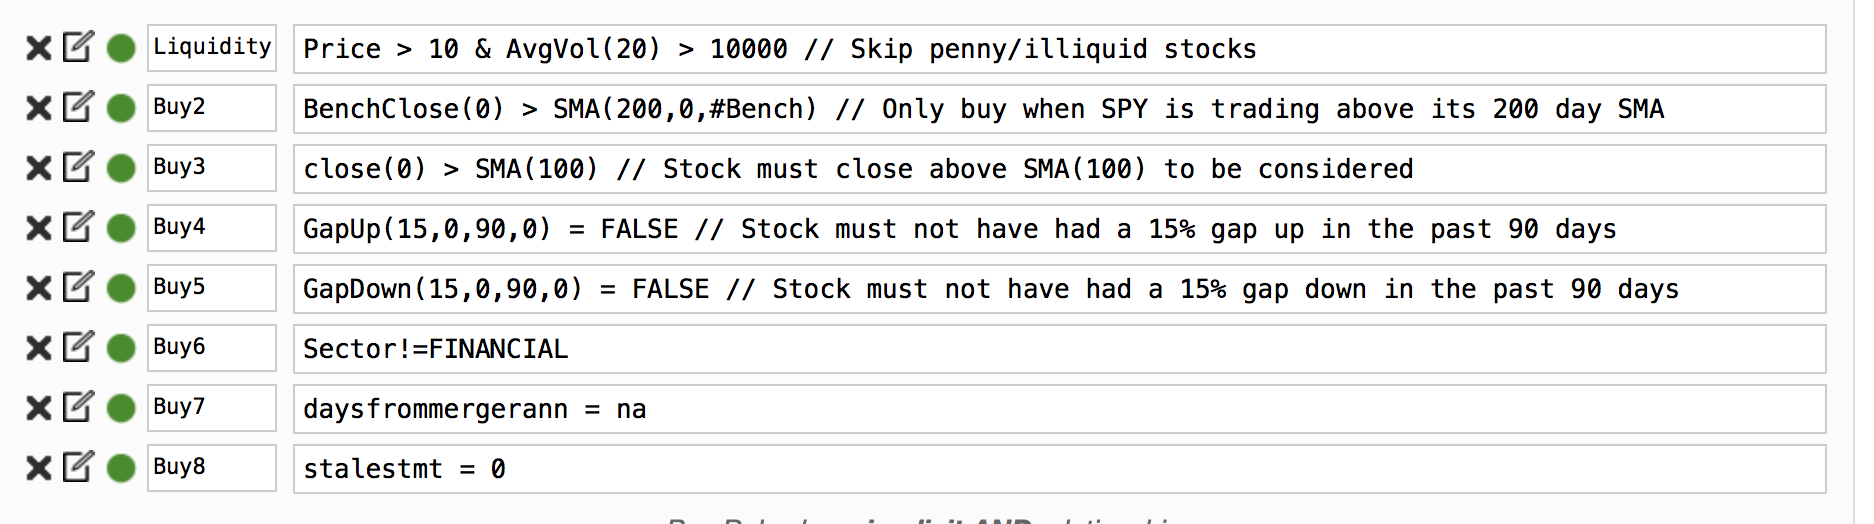
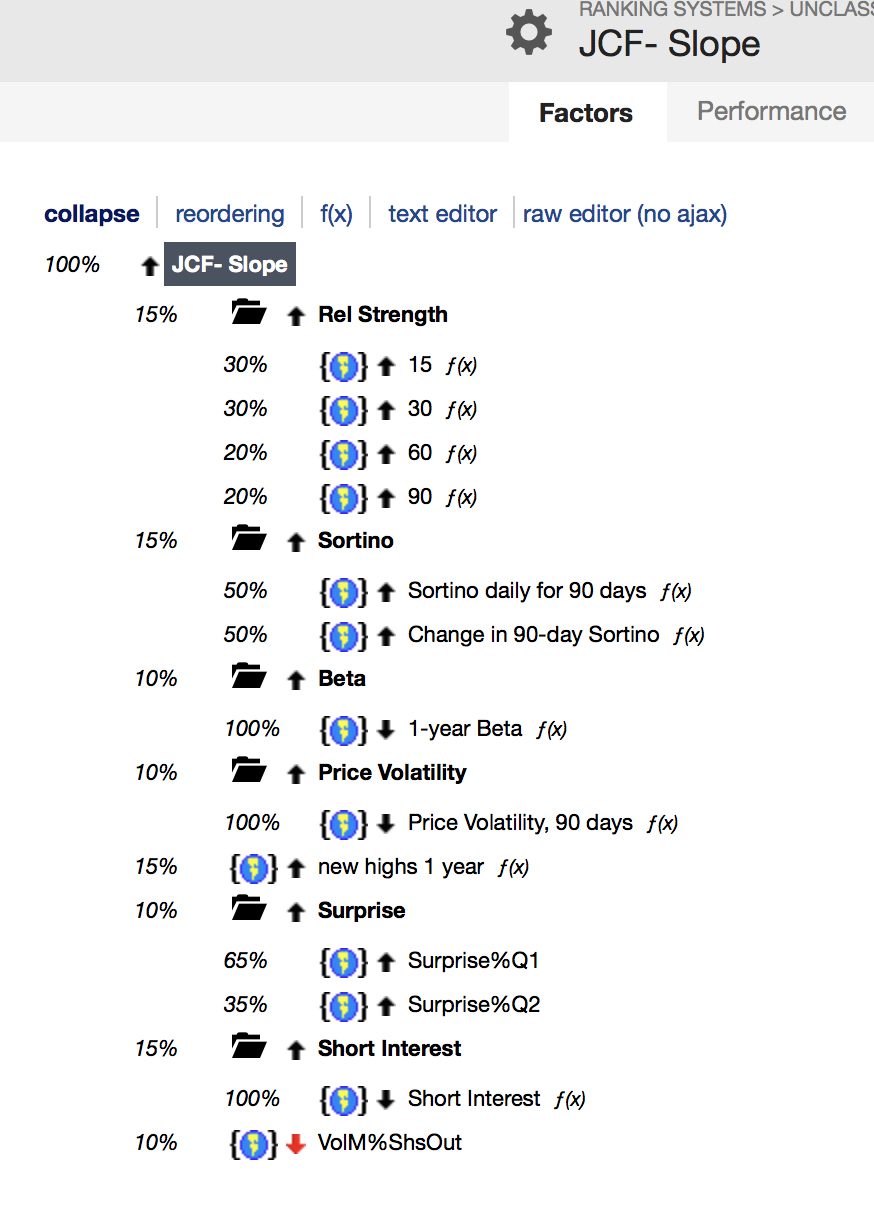
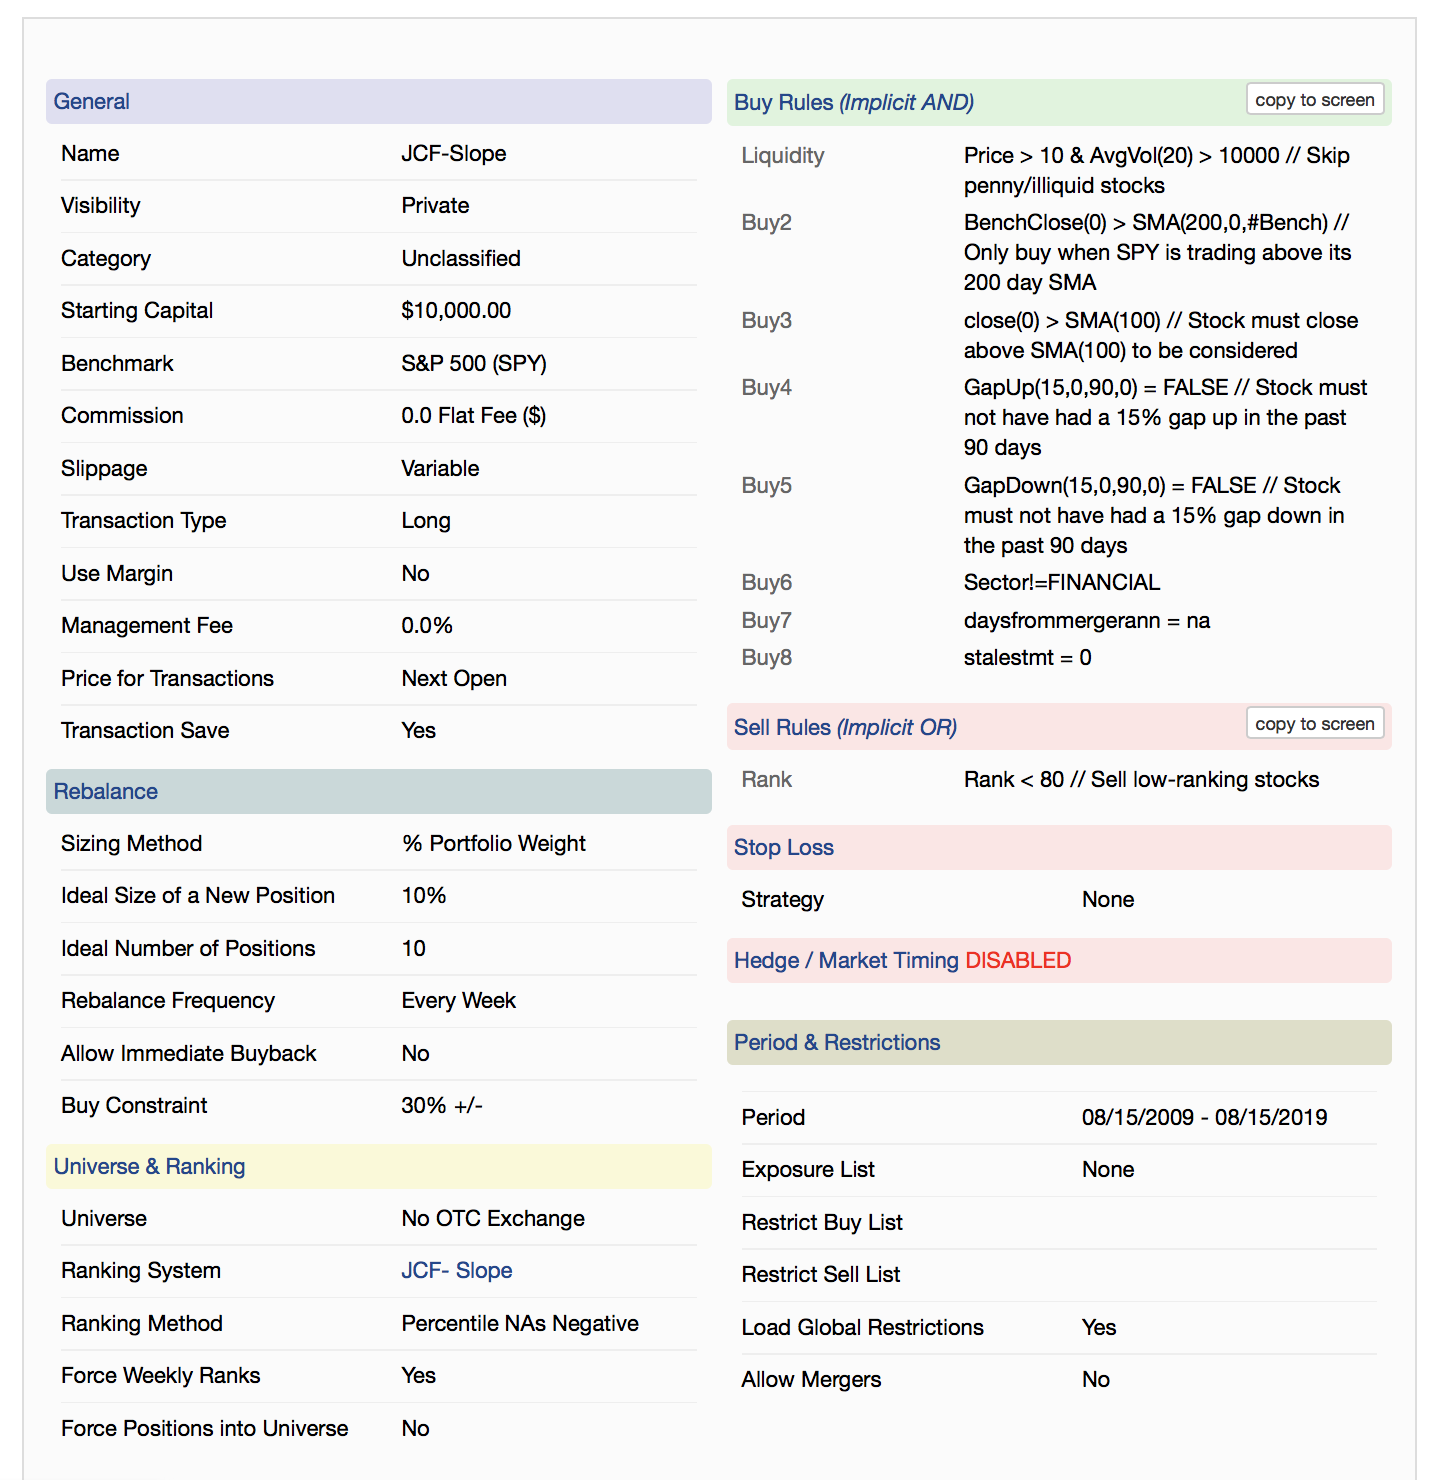
I’ve been working on a sim based on The momentum strategy of Andreas Clenow, as it’s related in the book “Stocks on the move”. The core of that system is a “regression slope”, here in P123 we have no regressions slope, as far as I know, just I found a volume slope (On Balance Volume (OBV) Slope), but anyway I tried to replicate the system with a few momentum and volatility factors.
Also I added a rule about new highs, just in order to improve the results.
Also I tried with VMA(15)/VMA(210), VolM%ShsOut, PctDev(60,1), but any of this factors do not improve the sim, on the contrary, they worsened the results.
I would like to know your opinion about that sim:
-How will you improve it?
-Do you think there is any optimization (bad one) here?
There’s no reason for your minimum price to be $10. There are plenty of very good quality lower-priced stocks. In fact, 128 of the S&P 1500 stocks are less than $10, and large caps like Ford, GE, Amcor, and Freeport-McMoran are all under $10.
A ten-stock simulation won’t tell you much about future performance. I would not judge the worth of a simulation on fewer than 25 stocks.
Beta measures the slope of the regression of prices versus the benchmark, if that’s what you’re looking for. I’m not familiar with “Stocks on the Move,” but regression slope is the same as beta. Use BetaFunc with the right parameters, and you’ll likely be able to do what “Stocks on the Move” tells you to do. If “Stocks on the Move” recommends the slope of regression of something else, like EPS or volume, you can get that with the formula ((sum of ys)(sum of x squareds) - (sum of xs)(sum of xys)) / (n(sum of x squareds) - (sum of xs) squared), which you can calculate given, say, ten representative samples in a custom formula or two, with xs being the benchmark measurements and ys being the measurements of the stock.
Also, some institutions are not allowed to invest in stock with a lower price, I believe.
This prevents some institutions from “arbing away” the market inefficiencies. Meaning it is more like that there is a real inefficiency there and that you have a little more time before the inefficiency goes away.
If I am wrong I would definitely like to have better information. Indeed, I would like to hear anything on this that fills me in on some of the details. Admittedly, “Fast Money” (one place I heard this) is not full of details and may not always be right (or current now).
-As Jim pointed out I read somewhere that some mutual funds are not allowed to buy stocks under 5 bucks, and because of that sometimes, in my sims, I set that price as the minimum price. But in that case, 10 it’s what the optimizer sets as a best option. It’s just noise, maybe???
-About the number of stocks, I set 10 stocks because it’s what I can manage in real life. It’s a number of companies that I can follow without getting crazy and be aware of their results.
In all your simulations, do you use more than 25 stocks?? In real trading too??
-About beta, the formula you write it’s little bit complex to me, but I will try again with it.
Low-price stocks are a double-edged sword. Institutions often can’t own them, and again, that can be good or bad. The good part is that these are often under-researched companies that present attractive opportunities if approached thoughtfully. The down side is that small size is a substantial fundamental risk factor, a huge one. (See this on my blog for further details: “Small-cap Value” Is Not Just Value With A Smaller Size Filter – Acti-quant ).
The challenge in this is understanding the way market risk-on and risk-off environments impact this group. As we would expect from basic Economics 101, excess supply means lower prices and hence opportunities for the weakest buyers to buy. This applies in the capital markets as well as all others. For most of the period covered by our backtest data, we have seeb huge and often dramatically excesses in the supply of capital (and lower costs of capital, including interest rates). That caused huge amounts of equity capital to flow to the lowest quality companies, many of which are in the under $10 group.
In the past, low-priced-nano-cap-low-liquidity stocks were in great favor among p123’s most active users who, unfortunately, gave too much credit to their modeling prowess and little or no credit to the Fed for the results they achieved. When we had even a teeny weenie bit of tightening back around 2013, just after the first incarnation of designer Models came out, things got every bit as ugly as economic theory suggests. Many of the early designer models came from these users and the implosion of those models remans, to this day, the primary source of the ills that plague that offering. The tightening didn’t last so the party resumed and even now, Trump persists in bullying the Fed into keeping the spigot open.
I mention this to make the current generation of bottom feeders aware of the potential outcomes if the monetary climate changes.
Whatever you do, it’s important to always challenge yourself: Am I really good, or just lucky? Back in the early 2010s, when I edited a low-priced stocks newsletter, I measured myself against a custom benchmark I manually built on p123 and with Excel processing that measured only the bottom-feeder part of the market, a segment for which there is no established benchmark.
[/quote]
For a purely model-driven portfolio, 10 positions is usually too low. The main category of exceptions would be for ETFs (5 may be too many) or very specialized strategies.
But if you want to bring the human element into the process - i…, follow the companies and potentially be willing to do things other than as exactly called for by the model — then your approach is correct. Have as many or as few positions as you are comfortably able to follow, and that number will vary from person to person and depending on how prominent the human element is in your strategy.
I’m not sure what “optimizer” you’re referring to, but, yes, a $5 lower price limit makes much more sense to me than a $10 limit. I can’t think of a good reason to exclude companies like Ford and Freeport-McMoran from your universe. If you’re looking for undiscovered gems, an even lower price limit would be wise, but a momentum strategy is normally not one that looks for undiscovered gems. Stocks under $5 have a reputation as riskier investments, one that may well be deserved.
If you’re simply trying to simulate what you do in real life, go ahead and run a simulation with 10 stocks. But if you’re trying to figure out what is likely to work in the future, I think you need a LOT of data, and ten stocks simply isn’t nearly enough. (I use the words “likely to work in the future” in the sense of probability: a simulation that’s really robust–lots of stocks, rolling periods, not overoptimized–that gets high returns has a very slightly larger probability of working in the future than a very similar simulation that gets low returns. This is, of course, my opinion, and not Portfolio123’s claim. But I always test at least double the number of stocks than I’m going to actually invest in.)
In real trading I have, over the years, held between 15 and 40 stocks at a time. Currently, I’m holding 20.
The optimizer what I’'m referring it’s on Research/Tools/Optimizer. But I’m pretty sure you already know it. Don’t you use it?
That concept about to develop the sim with more than 20 stocks, in order to have more data, and then at the time to real investing reduce that amount it’s very interesting. It hadn’t occurred to me.
Thanks.
Mark: thanks a lot for your comments too, I appreciated it.