I would like to ear your opinion about a sim I’m working with.
I apply two ranking systems to that sim, the sim just invest in one sector.
The first ranking system is complex ( to me…), with 13 nodes, and a few subnodes. The second one it’s more simply, just have 8 nodes.
Both share identical nodes, just the second one have one technical rule more, nothing complex: ema(20)/ema(200).
Both combine fundamental rules with technical rules (relative strength and one about volume). No Hedging.
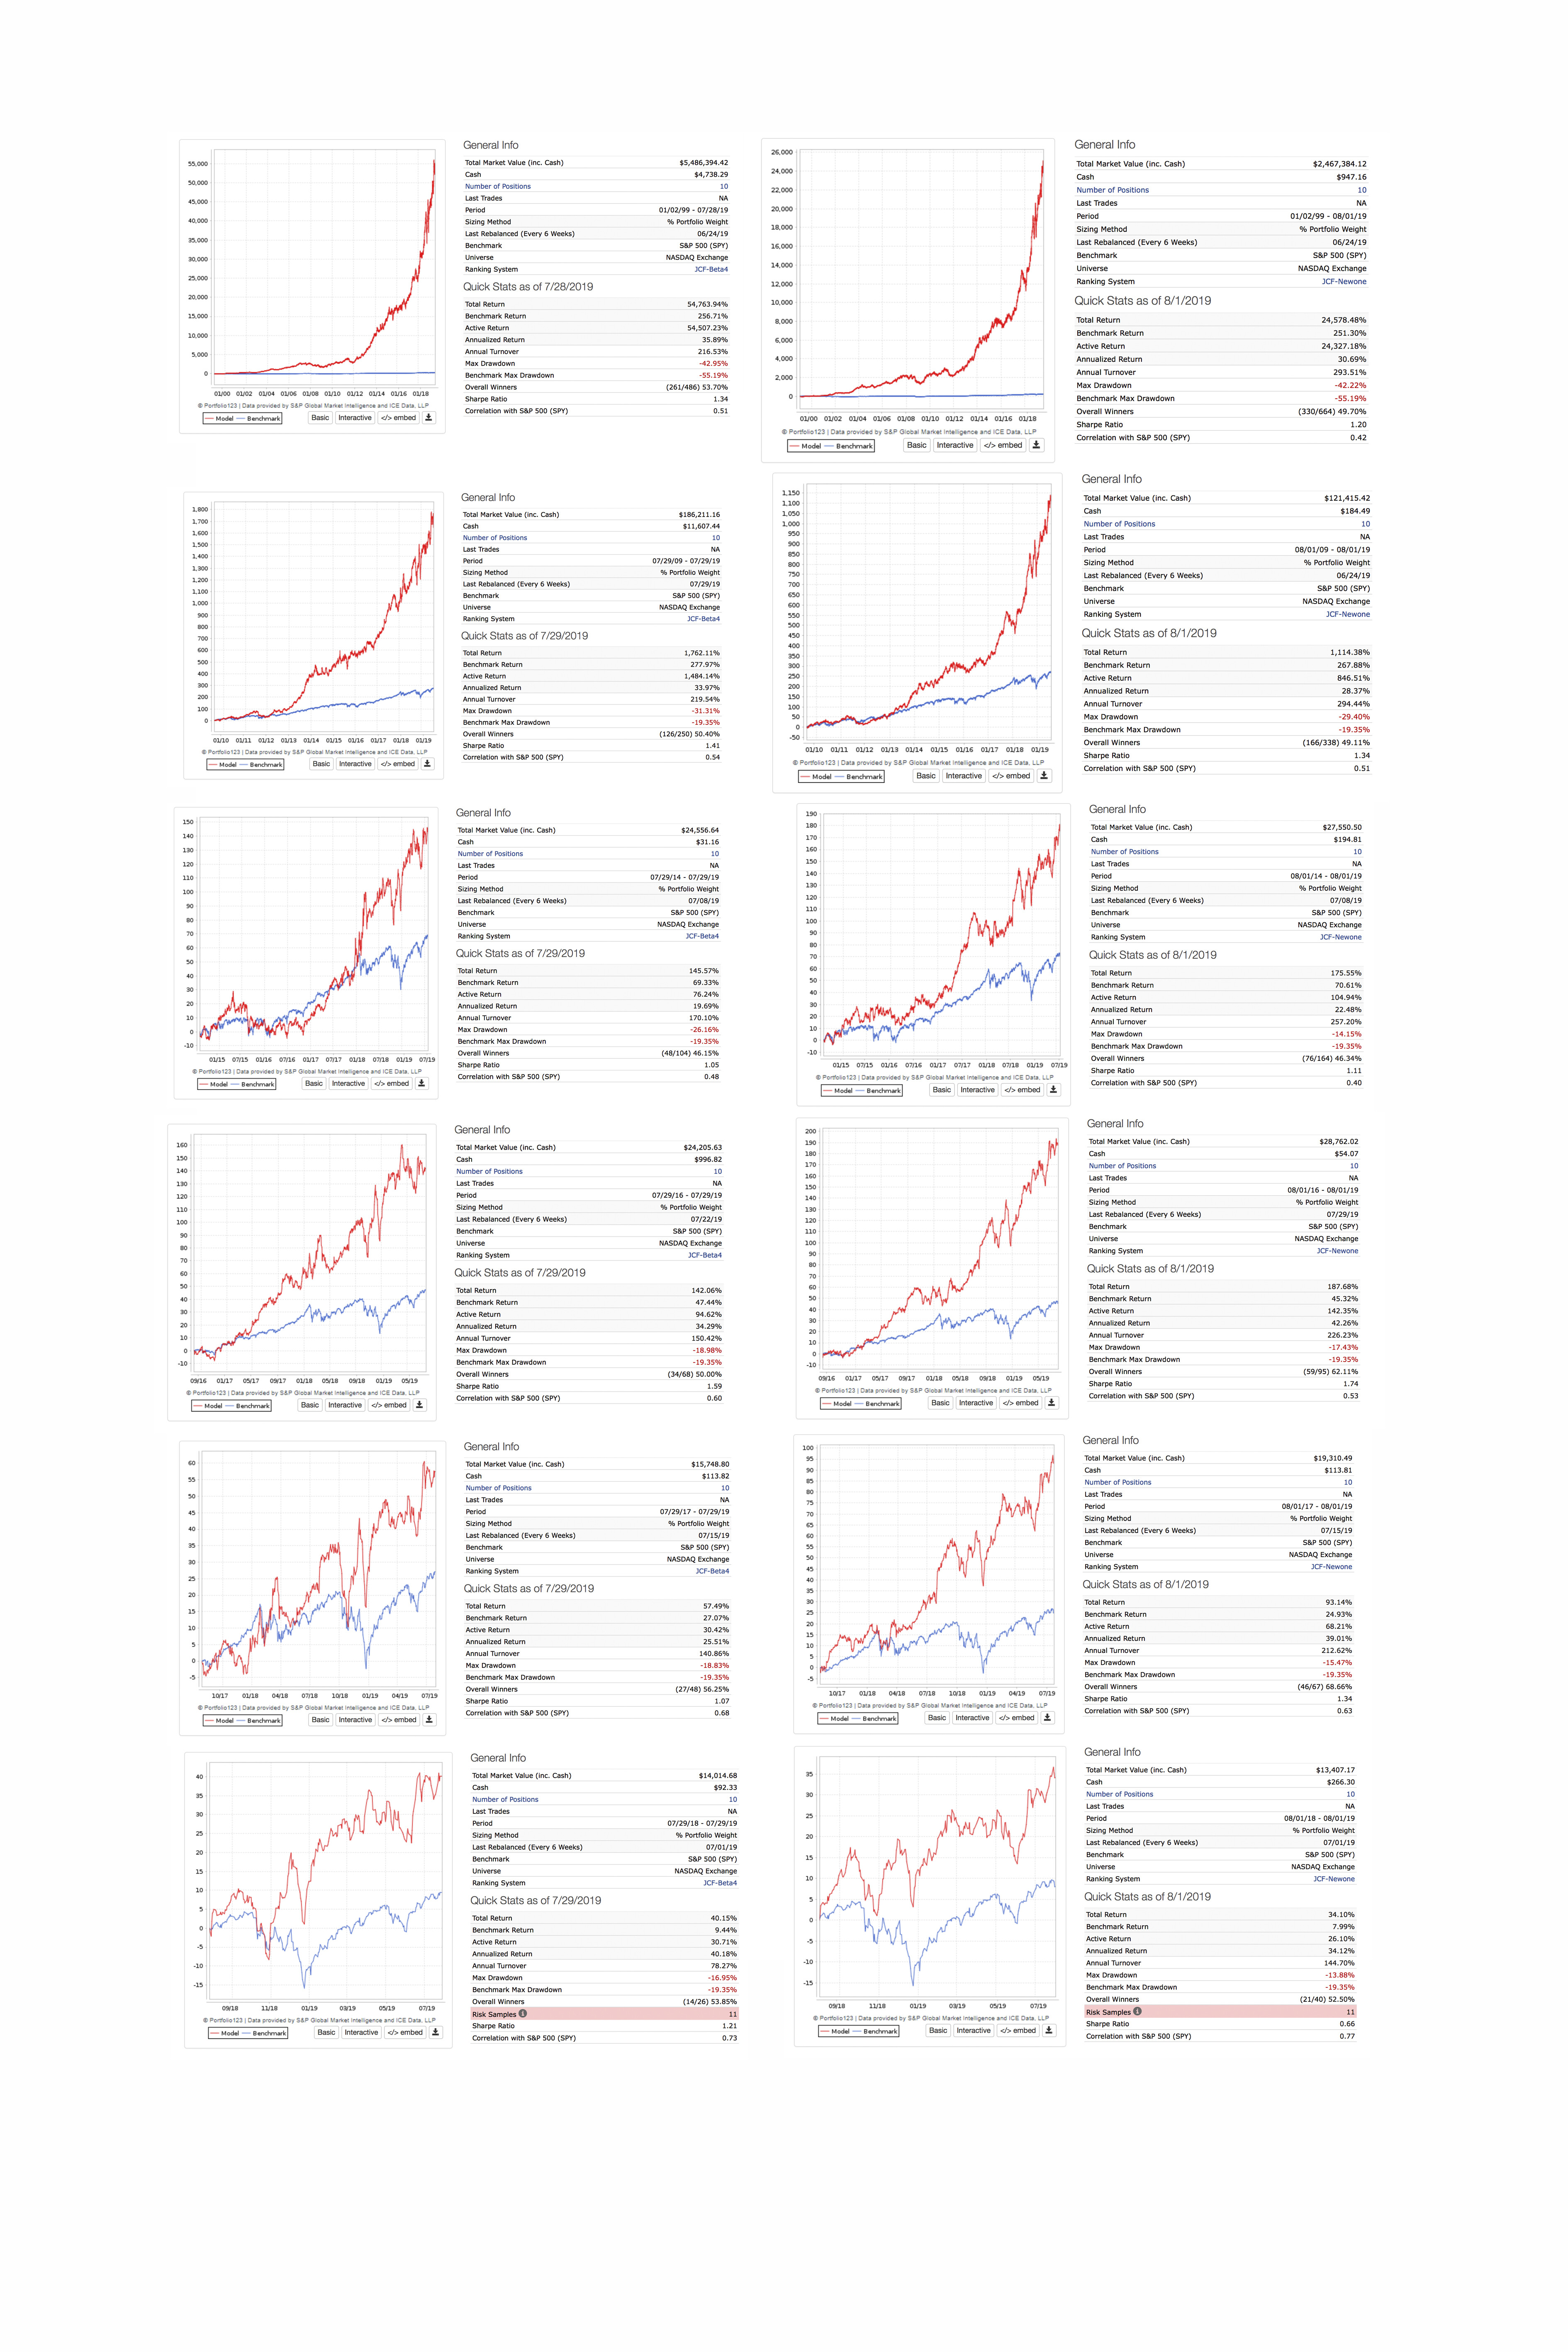
When I backtested, the complex (13 nodes), show a very good performance in 20 years, 10 years, and so. But the second one, the short, it’s clearly better in recent times, say 5 years and ahead.
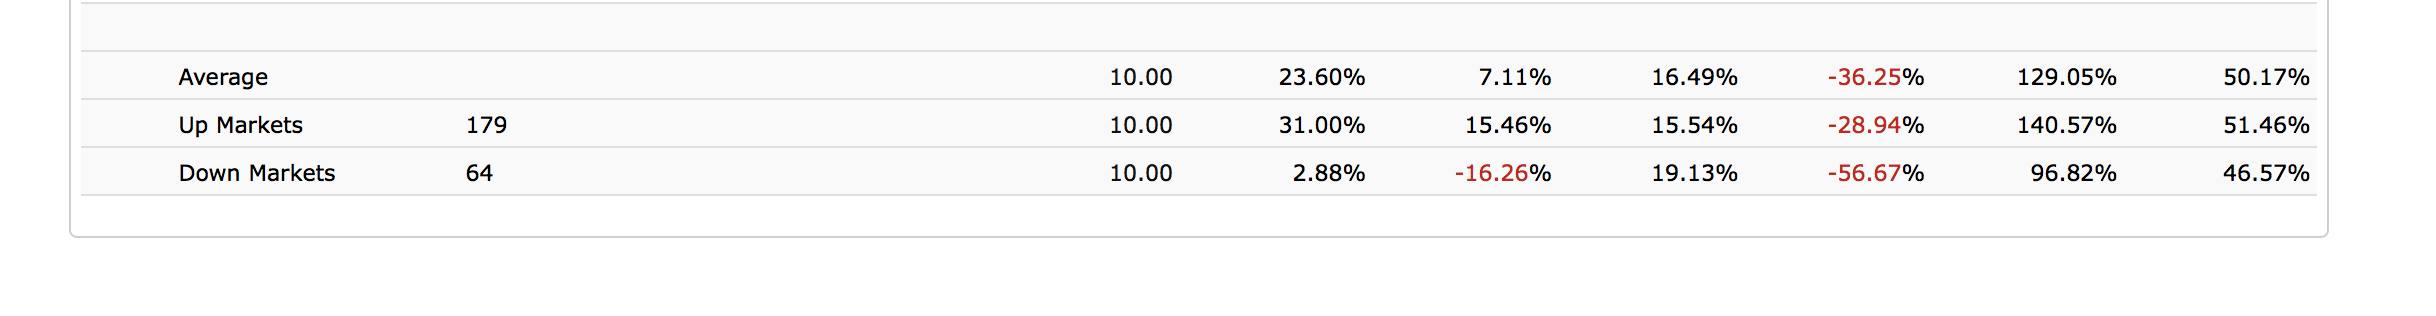
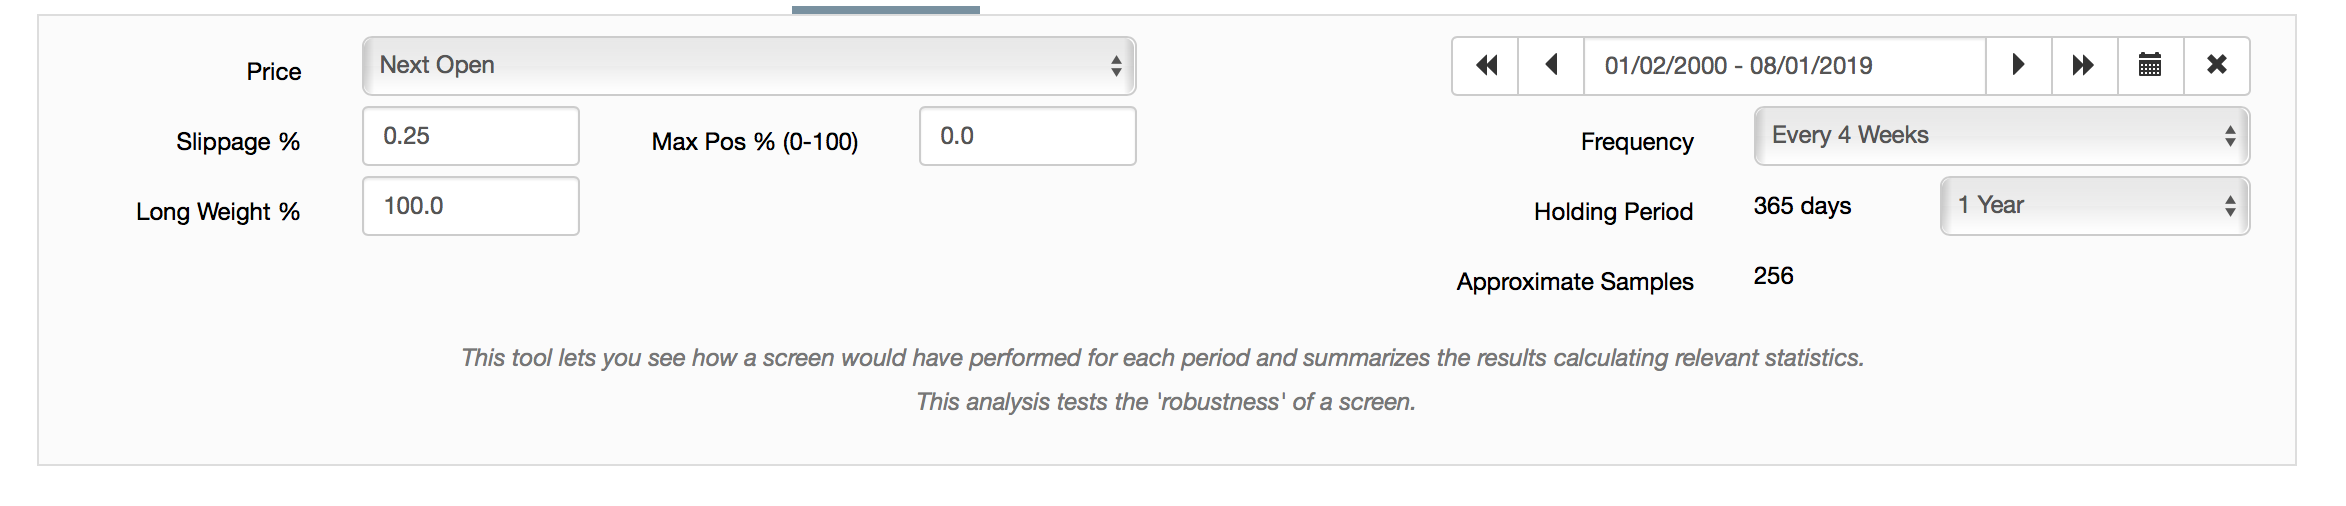
running some rolling backtests with 4wk offset and 1yr period
With such a high AR and low turnover I would look at my top realized stock and put it on a restriction list and run the sim again. Do that several times or until the port really breaks down. Then repeat the exercise for the alternate ranking system. See which ranking system breaks down first or the rate of roll off. If you want to take that one step further then you can do that for various time periods and confirm or refute the robustness.
Given two systems, one with more nodes than the other, I would choose the one with more nodes; and given two backtests, one that outperformed over a long period and the other that outperformed over a recent short period, I would go with the one that outperformed over the long period. So I’d definitely favor the 13-node system. The rolling backtest results look quite solid too. I’m writing not on behalf of Portfolio123 but offering my own personal opinion based on the tests that I’ve done.
Depending on the type of stocks a model picks, sometimes both long and shorter term mean reversion might be helpful (assuming this counts as a technical indicator). Usefulness seems to vary considerably dependent on the characteristics of the subset of companies that the model selects. I’ve had some cases where adding mean reversion can substantially help a model in a robust way, but other times it can hurt it - so I can’t generalize. I guess I have a “buy-the-dip” streak in me, and this is a way to express that on different time scales to see if it applies to a certain type of selection criteria.
While most charts will phase between trending and mean reversion, I suspect there’s probably a more general way to classify stocks as having more trending vs. more mean reverting or oscillating tendencies based on the shape of their charts, but in addition to that, maybe certain combinations of factors/sectors may work better with mean reversion, and others not. (I’m totally speculating here - but it seems to me there are cases I’ve encountered where it was surprisingly effective, and others where it was totally useless).
Volume-weighted momentum. I use VMA(15)/VMA(210), higher numbers better, but play with that. The reason this works is that stocks that have had an increase in price AND volume over the last ten months tend to be stocks that have a good reason for the change. As Marc Gerstein put it recently, “On day 1, a stock moves because of reason A. If reason A continues to exist on days 2, 3, 4, etc., the stock will continue to move as it did on day 1. It’s a lot easier to talk in terms of momentum rather than in terms of the sustainability of the underlying reason for the price action.”
Price volatility. I use PctDev(60,1), but you might want to play with that. Lower numbers are better. Less volatile stocks present less risk and will help cushion your portfolio.
why stocks with high number of share turnover are not good? share turnover is not referring to liquidity and the more liquidity a stock have the better?
Be careful about taking anyone’s advice here since the absence of details precludes anybody from doing anything more than guess.
If I’m being shown test results only, as with your images, my automatic preference would be to favor the ones at the bottom. Having seen so many tests from so many people over so many years, I’ve come around to the view that tests that look magnificent need to be approached with a guilty-until-proven-innocent starting point re: the potential for data mining.
I like use of many nodes, but between 8 and 13, nether are skimpy enough to push me in one direction or the other. I’d have to see the details to offer a better judgment than that.
A 20-year test period is much better if you aim to articulate universal truths; if you’re an academician looking for publication ad/or tenure. The reality, though, is that these periods are never static. There are sub-periods within them that can differ considerably from one another, and structural evolution can render earlier years irrelevant, or possibly dangerously misleading, as a valid sample. In fact, consider where we are today: Interest rates are major drivers of stock prices across the board. Given where are are now in the interest rate cycle, the likelihood that the 20-year period will be misleading has never been higher. So for those who, rather than seeking academic honors but instead just want to do well in the market, I favor a healthy does of “recency bias.” But even this can’t be viewed naively, since given the way the market is being influenced by Trump’s bullying of the Fed into nano-rate-cuts even as we drift near zero. So pay attention to intervals when the market was reacting to or contemplating rate increases.
I wrote an article about this, which is worth reading, but in sum, share turnover has nothing to do with liquidity. Berkshire Hathaway has the lowest share turnover of any stock in the S&P 1500, and Walmart is ranked #5. As I wrote in my article, “To generalize, older, established, and somewhat boring companies (widows and orphans), often with high-priced shares and low short interest, have low share turnover; and cutting-edge, exciting, controversial, highly hyped, turnaround, high-momentum, and/or heavily shorted companies have high share turnover.” The higher a company’s share turnover, the higher its beta is going to be, which means the more it’ll be moved by the market. If you want to invest in companies that are relatively impervious to market movements, invest in companies with low share turnover.
Agree with above. I didn’t realize #1 and #3 were considered technicals, but I use both. I’ve had more difficulty employing momentum based measures, though I understand many use them successfully and supporting academic evidence for use is overwhelming.