In the market wizards books several of the traders mentioned they might have a win percentage in the 40s%. I’m going from memory, but I think this might be expected for trend traders who might expect to get stopped out and take small loses quickly (cut losses short) on repeated attempts to catch a trend while waiting to finally catch a ride on a big gainer.
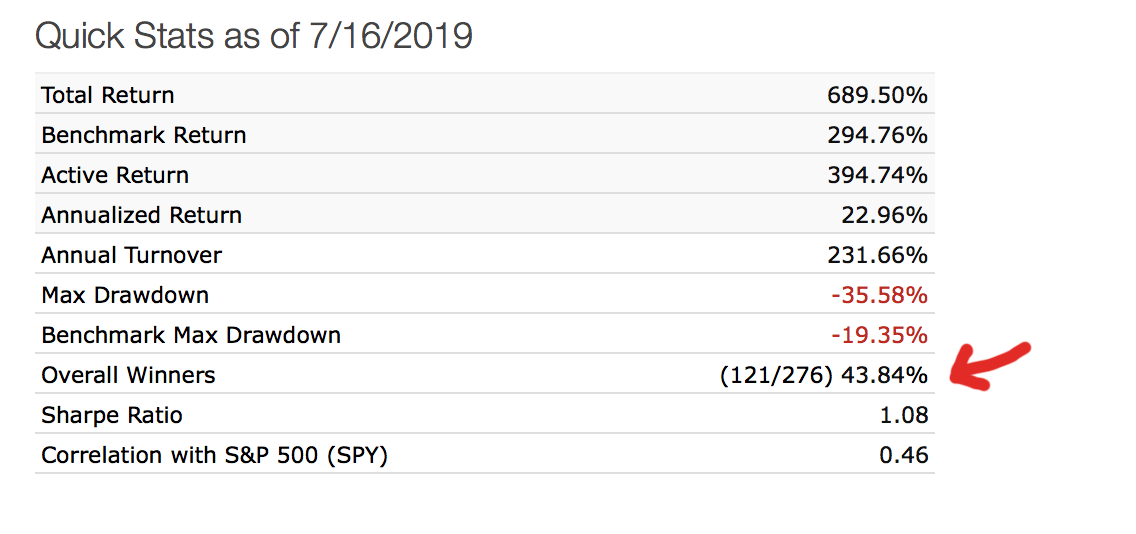
Just looking at the stats above one thing to consider (all of this is imho) is the high drawdown relative to benchmark. Without more info it’s hard to say much, but that would be a concern to me.
Personally I want to see a stock winner rate between 40-70%. I’ve never made a sim I liked that was outside of those values but I have seen some posted that are. A lower win rate with positive performance means you had larger gains from your winners than you had losses from your losers, however you had more losers than winners. That’s not necessarily a bad thing. If your system was designed to hold the winners and cut your losers then it’s very likely that you’ll see this. I will say that I also get suspicious if I see a high win rate with low turnover. That combination leads me to believe there was more curve fitting going on and I have less faith in future returns/win rates. If the win rate is above 70% then I would need to see some rolling back tests along with some restriction testing to believe in it a little more.
These are just observations, I have no hard data to back any of this up. I consider this more of my guideline rather than a rule.
If you were a monkey choosing random stocks out of the Russell 3000 and holding them for three months, you’d have a win rate of about 52%. That’s because the stock market generally goes up.
There is no magic formula. A high win ratio only matters in context. The slower the turnover the higher the win ratio you will get because stocks generally go up. If your system was just to hold for 10 years before selling, your win ratio might be 90%. But you might also have under-performed the market.
It is a mixture of how much you win and lose per trade versus holding time. What I like to do is calculate how much return per day a system makes after costs. Take average % of trade and minus something for slippage and commissions. Then just divide that by average # of days held. That helps me compare systems with different average holding times. I don’t put much stock into % winning trades.
Is there a way to duplicate a benchmark or ETF and have a sim alternately buy and sell one of them, the real one or its equal? That would allow a sim to report a benchmark win % associated with the reconstitution periods of a model. I will explain my reason for asking:
I really would like to make use of the Overall Winners % statistic for a sim, but realize there are very good reasons to discount it.
(1) It doesn’t include the impact of dividends. This makes the reported percentage a bit smaller than reality for some models.
(2) It is significantly impacted by turnover rate because stocks in general trend upwards in price, so low turnover should lead to a higher win % regardless of the model’s effectiveness.
(3) Models designed to hold jewels while cutting losses could have a lot of small losses and a few large profits, with a low win % but a good return.
I prefer to design successful (better than benchmark return with smaller drawdowns) models that don’t rely on a few jewels outperforming a lot of small stinkers, and don’t rely on long holding periods. In this way, concerns (2) and (3) can be set aside. (1) is just a given unknown whose impact can be estimated.
If I could compare each stock round trip to a round trip of the benchmark for the same period, I would probably feel better about models that match or exceed the win % of the benchmark round trips. Calculating such a comparison is straightforward but requires a lot of effort.
A simple measure that, in my opinion, might provide insight is a win % for the benchmark, as if the benchmark is bought and sold at each reconstitution date. This doesn’t account for each stock or ETF round trip but should help comparisons to the overall market trend. To this end, I can create a sim that holds etf RSP or SPY only, for example, but I cannot set the sim to buy and repurchase the same entity each reconstitution period to report a win %. On repurchases, the system assumes there is no turnover when the same entity is sold and immediately repurchased. I can alternate between two etfs like RSP and SPY, and get a win % reported. When I do that, the statistic is skewed a bit but seems helpful and causes me some concern regarding one of my actively invested models. That concern will fuel some further modeling!
Hi Bob,
It sounds like you are asking for a trading stat that is like ‘Rel Overall Winners’ which would be the % of trades that beat the benchmark. Is that right?
For a short term solution, you can do this manually using the simulation’s transaction history and downloaded prices for the benchmark you pick. I attached an Excel file that does the calculations using that data. Hopefully you have access to Excel. If not Google Sheets should be able to convert this file, although I didnt test it.
To generate the transaction history from the sim, go to the Transactions tab then to the Realized tab. Click the Download button. Paste that data into columns A thru J.
For the ETF prices, go to the Prices tab in the Data section for that ETF and click the Download button. Paste that data into columns T thru X.
The example only has the 2021 prices for RSP and a few transactions from one of my sims. Yours would have a lot more data.
This isn’t a direct reply to your question, but here’s what I do.
First, download the realized transactions. In columns B and C are the dates of each position’s open and close.
Then download the prices of the benchmark. You can do this by running a screen backtest with the correct benchmark and downloading the results. Copy those results, along with the dates, into the realized transactions file.
You can now use Excel’s XLOOKUP command to get the benchmark prices and returns for each period. Let’s say column K is the benchmark date and L is the benchmark return. The formula for the benchmark return that corresponds to the open/close dates would be
=XLOOKUP(C2,K:K,L:L)/XLOOKUP(B2,K:K,L:L)-1
Copy that all the way down in column M, say.
The formula for the percentage of winners compared to the benchmark would be
If one does something like a t-test one can get significance MUCH, MUCH faster doing a paired t-test on stock data.
In fact, you usually cannot find significance in the data doing a t-test that is not paired. The same goes with any machine learning method. It won’t work without the excess returns.
For this reason I usually use the excess returns column (when available) from the sim or port download. It is available for returns of the port or sim over the rebalance period. A one-sample t-test run on the excess returns is like a paired t-test.
The excess returns downloads from a sim or port are an example of a very easy and very useful download. And there are Excel spreadsheet methods for people’s other needs as presented by Yuval and Dan above.
Anyway, excess returns can be downloaded from P123. Sometimes very easily. One of the reason that P123 is the best machine learning platform for retail investors on the planet.
I wish p123 published a stat of % winning vs the chosen benchmark for the same hold. That’s what i do in my personal portfolio. Otherwise, might as well buy the index.
[quote]
…any…method…won’t work without the excess returns.
[/quote]Fixed that for you.
It should be obvious to most of us by now that absolute returns tell us very little. Only excess returns are meaningful. Not only for machine learning, but for brain learning too. After all, the human mind is quite powerful at spotting patterns in the data.
Therefore, most stats should list excess returns. This includes designer models, realized sim transactions, etc. This would give users the information we need to make meaningful decisions.
I would write up some feature requests on this but why waste time? Very few of my feature requests have been implemented–despite assurances.
Alpha is a sophisticated way to measure excess returns. We give you alpha for live strategies, simulations, screen backtests, and designer models.
There are other ways to measure excess returns. You could subtract the annualized return of the benchmark from the annualized return of the strategy. You could subtract the actual return of the benchmark from the actual return of the strategy and then annualize the result. Those two methods, both of which I’ve seen used, give two different results, and personally I don’t think either is as useful as alpha. But I could be convinced otherwise. For simulations, in addition to alpha, we give you the “Active Return,” which is the excess return unannualized.
I agree that adding excess return to the realized transactions would be useful, as would adding an extra line for win/loss compared to the benchmark. I’m not convinced of the need for adding excess return to other parts of the website, though. I am, however, willing to listen to an argument in favor of it.
How about the performance tables for portfolios and DMs? Shouldn’t they list annualized excess returns (pick your favorite measure of excess returns) since inception; i.e. OOS? After all, how can you compare performance of two portfolios if one was running during a bear market while the other was only during a bull market? And how can you compare in sample excess returns to oos excess returns?
Chaim,
I’m not sure what you’re asking for. Could you please clarify? We already show excess returns in portfolios and in DM’s it’s a matter of simple subtraction. See below.
Performance by calendar year is a great tool. It would be great to show it when comparing ports/sims in this table. It would be even better to compare ports sims visually, via a chart of rolling returns over a customizable period (1Q, 1Y, 3Y, etc). The out of sample date for live portfolios should be marked on the chart. The oos date is in most cases the creation date of the portfolio.
When looking at an individual DM, we have the ability to look at excess AR post launch as you pointed out. However, this info belongs in this table as well. In addition, rolling returns for DMs would be extremely valuable, with an indicator showing the launch date. 1Y excess returns are not very useful, since there tends to be mean reversion.
Personally, I would like to see excess returns since inception in the Excel download of the DM models–allowing me to sort the spreadsheet.
Maybe see if the median model is beating their benchmark. Or see if a designer is consistently outperforming (or underperforming) the median with all of their models. Or more generally, use the sort of the excess returns to pick a model.