I had a crazy idea, and I want to share it with you to know your opinion about if I’m acting the fool or not…
My intention is to check what happens if you depart from the same fundamentals and then add a condition in order to decide what is better: buy that kind of stocks that are undervalued or the same kind of stocks but overvalued.
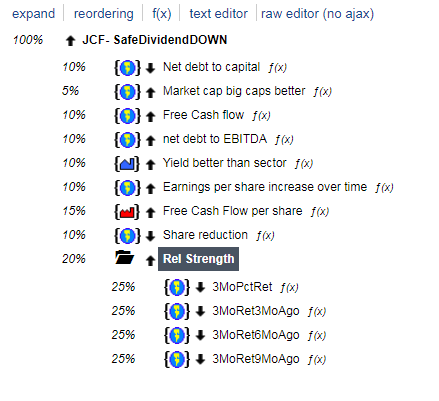
For instance, I did that on my last sim, one based on dividend investment, and I just add a technical formula in the ranking, giving to that formula a weight of 20%.
I defined the downtrend like this:
Close(0) / Close(60) – lower better-
Close(60) / Close(120) ) – lower better-
Close(120) / Close(180) ) – lower better-
Close(180) / Close(240) ) – lower better-
Assaining to every formula the same weight (25%), and then higher values for the principal.
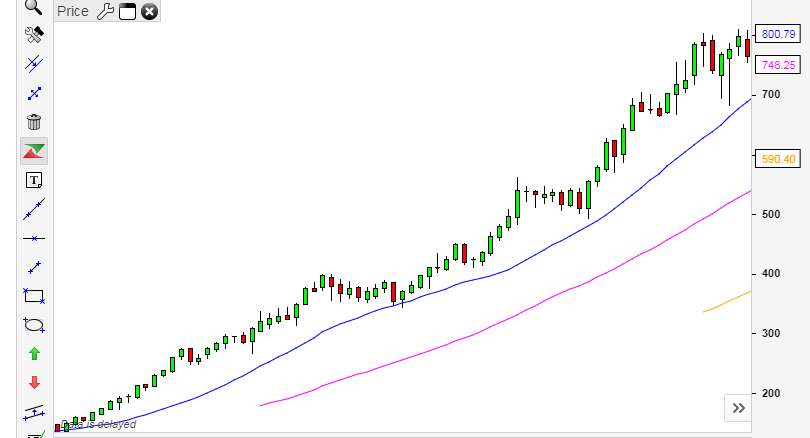
The aim is to catch stocks that are in a clear downtrend, for instance like the picture I attached here (ok ok, the contrary than the picture, but I’m sure you get the point).
Do you know other way (better) to do this?
How can I do the same but with lower volatiliy or steady trend?
What you’re talking about is known as regime switching. The most challenging aspect of this is getting a good set of rules to tell you when to switch regimes. If you want to get a discussion going on p123, use the phrase “market timing” instead of regime switching.
However you choose to implement it, you may want to dive into the Help materials and look into the conditional ranking system node. That’s where you define your switching rules – in your example, these would be the various return factors you specified. The idea in this part of the system is to come up with a Yes/No answer. Then, your ranking system has two independent branches. One branch operates when the Yes condition us satisfied (i.e. an uptrend as you defined it). A completely separate ranking system out operate instead at times when the no condition is satisfied (in your case, a downtrend).
LoopSum(“LowValBar(126,CTR)=CTR”,126,0) // $LVBCount, new low count within rolling window
LoopSum(“HighValBar(126,CTR)=CTR”,126,0) // $HVBCount, new high count within rolling window
Or,
(Close(0)-Close(126))/(LoopSum(“Abs(Close(CTR)-Close(CTR+1))”,126)) // Signal to Noise ratio
Try them out in the Screener as quick rank rankings.
Thanks a lot for your answer, but I think what you say it is not what I’m looking for. I’m not very good at explaining myself, let me try again:
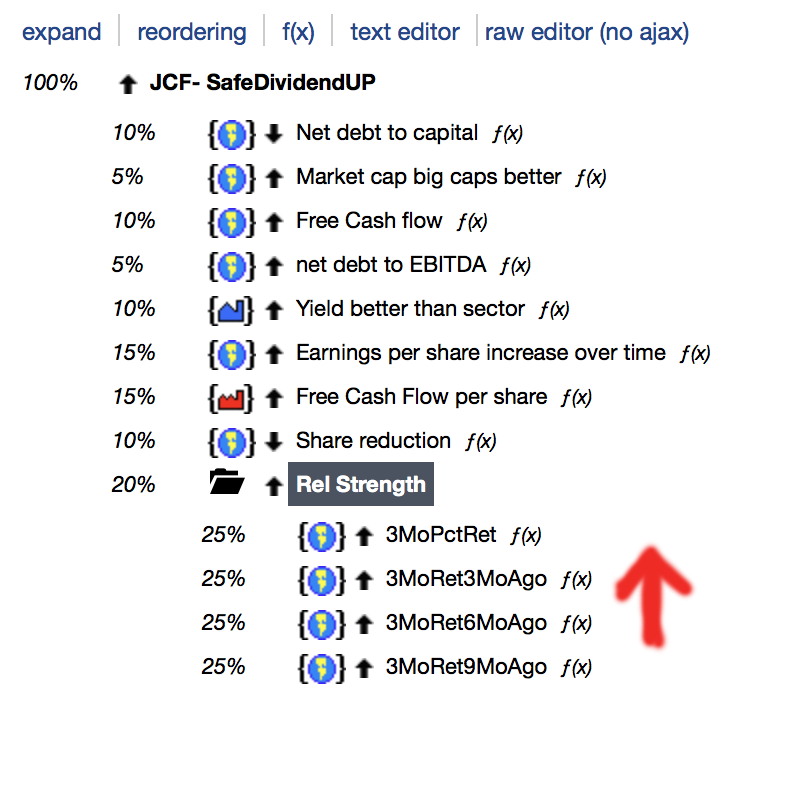
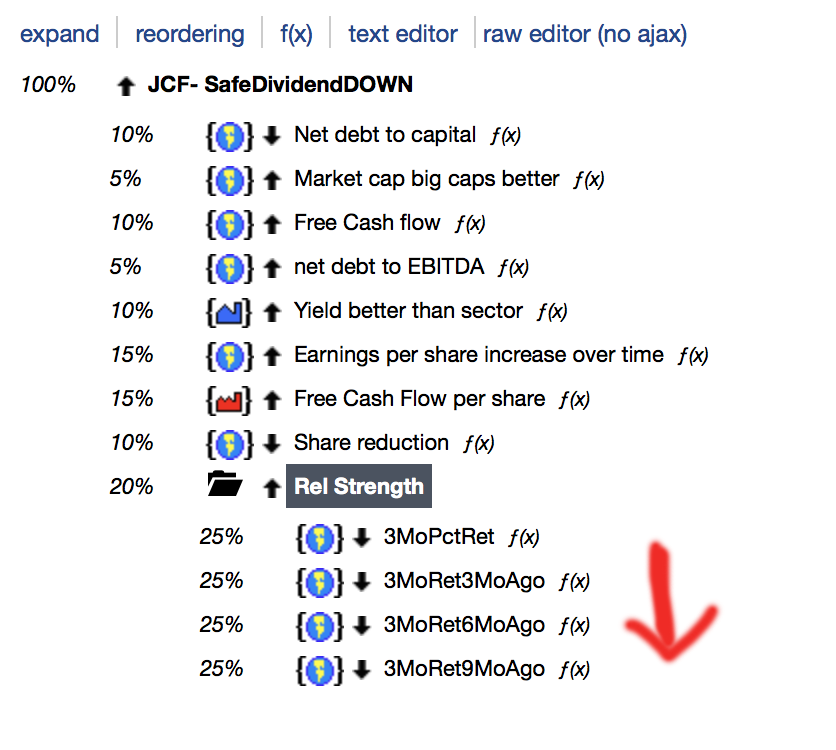
What I want to do is two ranking systems. Each one with the same fundamental rules, but each one with opposite technical rules.
The technical rules in the first ranking examine a downtrend, and in the second ranking examine an uptrend. But the fundamental conditions does not change.
And nothing else.
The intent is to understand how from some pre set fundamental conditions or statements the portfolio’s pertformance changes through a downtrend or an uptrend in price.
To resume; What is better, ¿To buy this x kind of stocks when the price goes up, or when the price goes down?
Hi, Try something like the below for various timeframes to get more tightly trending charts.
Essentially it sounds like you’re looking for lower volatility in a downtrend.
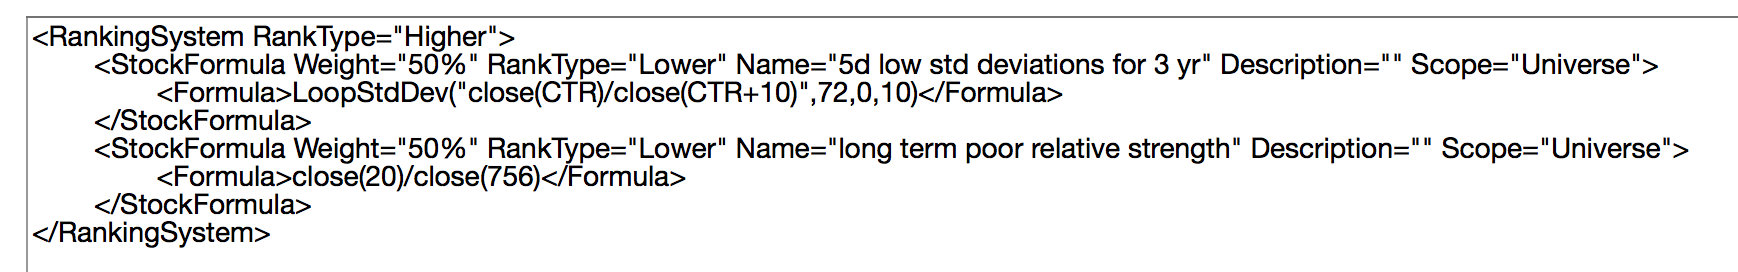
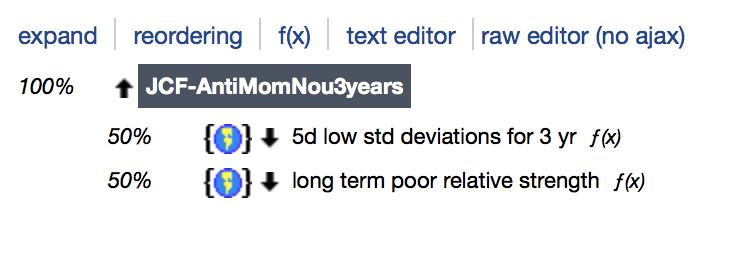
5d low std deviations for 1 yr: LoopStdDev(“close(CTR)/close(CTR+5)”,52,0,5) sorted where lower is better
10d low std dev for 3yr : LoopStdDev(“close(CTR)/close(CTR+10)”,72,0,10)
Mix in different timeframes and time windows as needed to cover your time period appropriately.
Then overlay with long term poor relative strength.
1yr rel str: close(20)/close(250) sorted where lower is better
3yr rel str: close(20)/close(756)
…
You’ll probably need to tweak it, but these combined tend to produce nicely trending charts. (I’ve used it for uptrends, but should work for downtrends too)
(Close(0)-Close(126))/(LoopSum("Abs(Close(CTR)-Close(CTR+1))",126)) // Signal to Noise ratio
I think of it as the change in price divided by the path taken to make that change. Strong up-trends will be closer in values to +1 and strong down-trends closer to -1. A value closer to zero indicates either a small change in price or perhaps a large change but one that had a lot of price movements (i.e. volatility) to get there.
I use a smooth regime switching method that will lend more weight to certain factors near a press release date.
It’s a bit difficult bc we don’t have have trig functions to work with. But hypertrigonmetric functions do the same thing and can be expressed algebraically.
I think what you’re doing inside a ranking node essentially does the same thing.
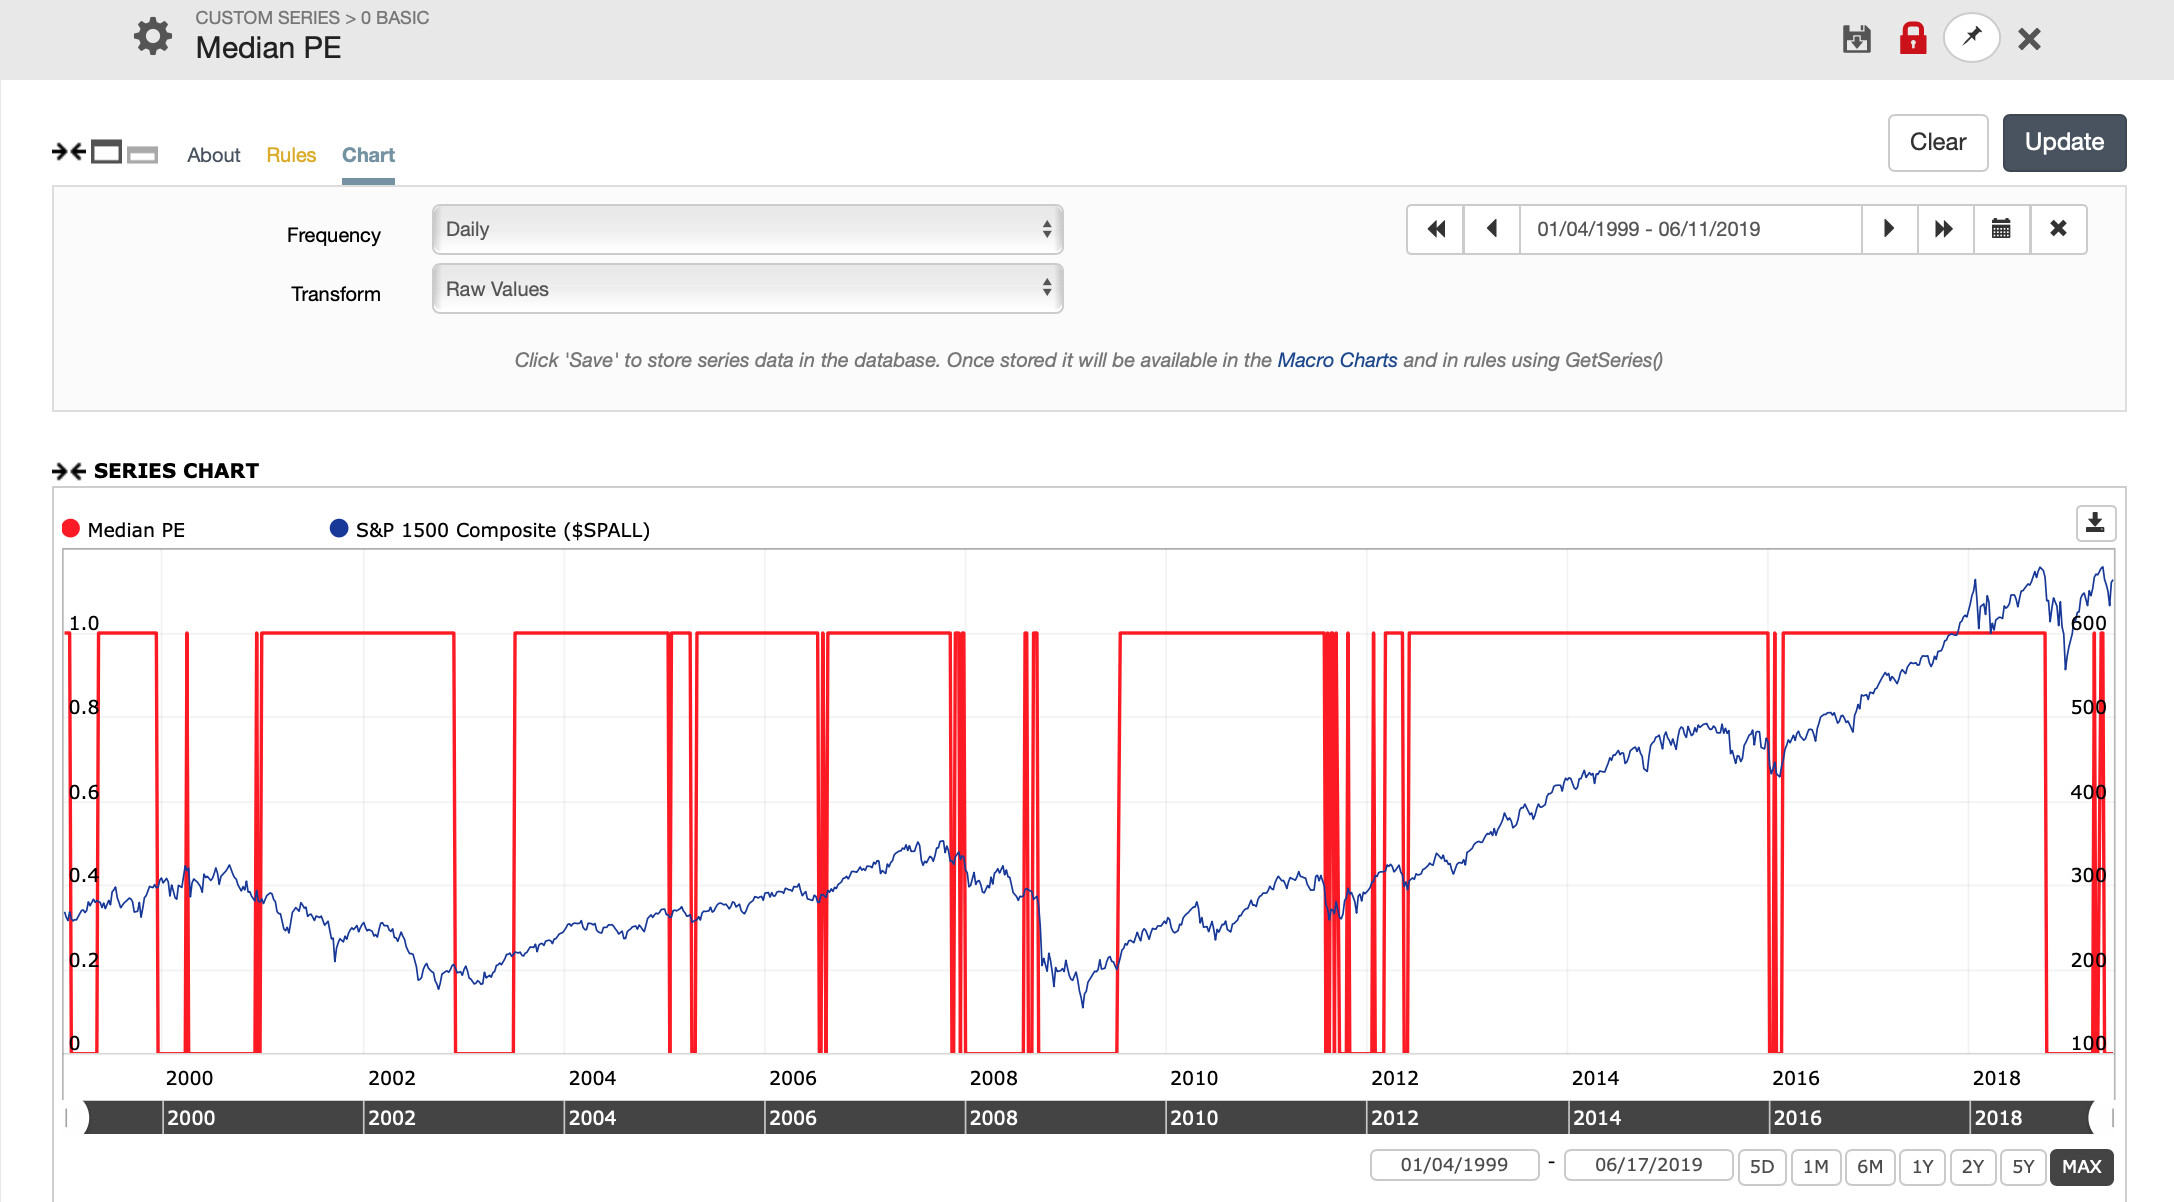
Speaking of regime change, I’ve been looking into that lately. I started with PE expansion to detect momentum periods. Attached is a Series plot of UnivMedian(PEExclXorTTM)/UnivMedian(PEExclXorPTM)>0.90. That threshold was chosen b/c the ratio can be noisy. I may add a bit of hysteresis to filter that noise and also look and UnivAvg, UnivCapAvg.
The series seems to capture momentum well except for the 2002 period. I think some work could explain that false positive. In addition, plotting PE expansion by sector, shows some current PE expansion in the Staples and Util sectors. Humm.
If anyone finds something useful, please let all of us know.
Sorry for my late answer, I’ve been busy these days, a lot of stuff to do, and also need to think about all what you said here, also implemented those things and run backtests and so on…
SpacemanJones:
Thanks a lot for your help. I tried the rules you said, but mine works better (if we talk about performance, I do not know why…)
Maybe I was wrong with the up/down arrows?!?!
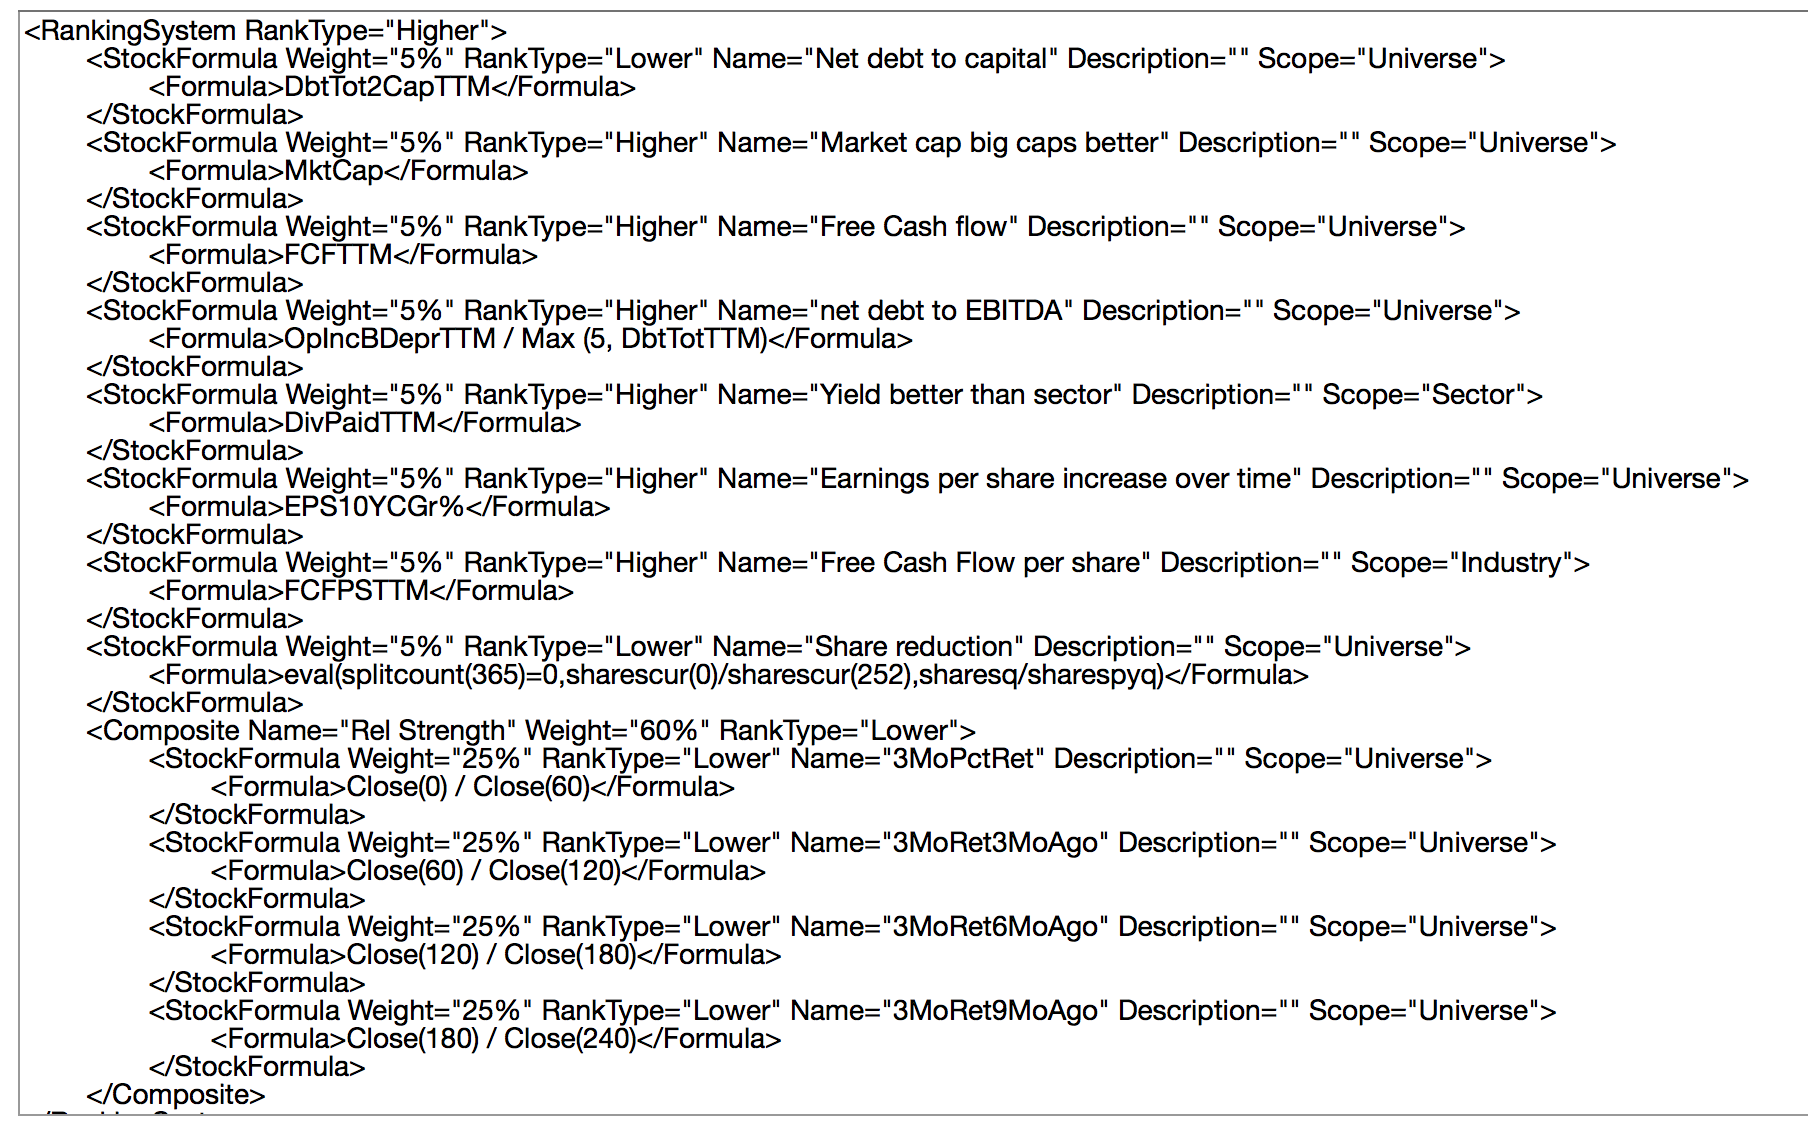
For instance, for looking for downtrends, in long periods (3 years), I did that in the ranking system:
But, anyway, when I tried to isolate the same fundamental “frame” with uptrends vs. downtrends I do not find consistent differences.
I do not get the point here.
At the end I tried to create a ranking system, with a lot of weight in the trend conditions, but the backtests results were very similar. So now, I’m lost.
I did something wrong? or all the approach it’s wrong??
I think the implications of your backtests are pretty clear: stop paying so much attention to historical prices and just stick mainly with the fundamentals. What has happened with a stock’s price over the last months or years is a lot less relevant to what will happen to its price in the future than its fundamentals.
Monday - you might try weighting the most recent 3 months highest, the furthest out 3 months lowest. Perhaps weight them 4,3,2,1 (but normalized). Then use ranking performance graphs and look at the buckets as it is more meaningful than backtest to start with.
Yes, I think you are right, but I started in this game with technical analysis and I still love to draw lines in a chart and I can’t avoid to experiment things here mixing technical and fundamental both together.