Sim based on dividends.

Hi all.

I would like to share a sim that I’m working on it, it’s based on a web page where they offer analysis focus on dividend investment (https://www.simplysafedividends.com), I’m a subscriber and after reading a few of their analysis I realized it’s all the same (more or less) and I can “extract” a system to invest focus on dividend investment just reading between lines.

The following are the points I departed from:

[i]net debt-to-capital- important.

net debt-to-EBITDA - (the lower, the better).

How long a company has paid uninterrupted dividends – important.

Larger businesses better.

free cash flow- important.

dividend yield better than industry

fordward p/E ratio better than industry

P/E ratio means that investors may have become pessimistic about prospects for growth.

Earnings Payout Ratio- below 60%

Free Cash Flow Payout Ratio- below 60%

Earnings Per Share- The best businesses will steadily increase their earning

Free Cash Flow Per Share- Advantaged businesses tend to generate stable, growing free cash flow over time.

Earnings Per Share Growth

Sales Growth- prefer steady, moderate growth (3-7%).

Shares Outstanding (Millions)- prefer a declining share count.

Total Sales (Billions)- prefer companies with fairly steady and moderately rising sales.

Return on Equity >10%

Return on Invested Capital >8%

Operating Margin >12%

Free Cash Flow Margin >5%

Net Debt to EBITDA <3%

Net Debt to Capital <0.4

Interest Coverage >8%
[/i]
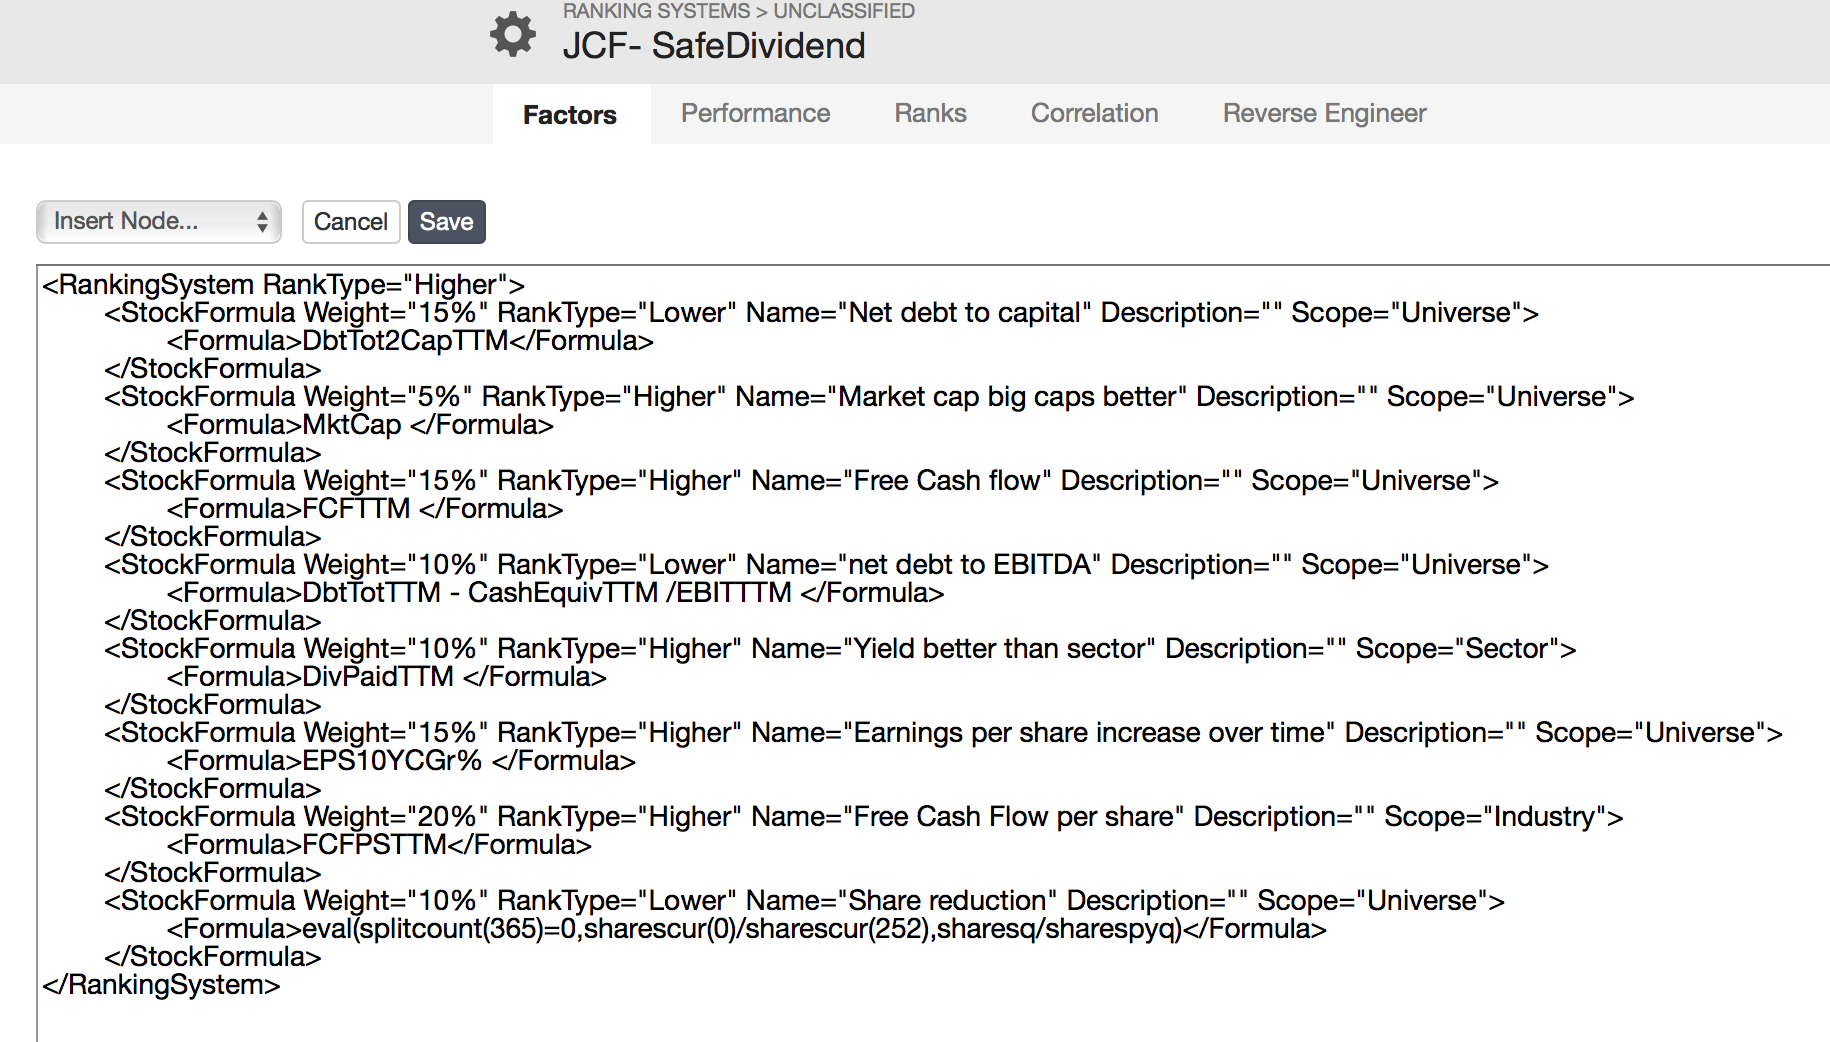
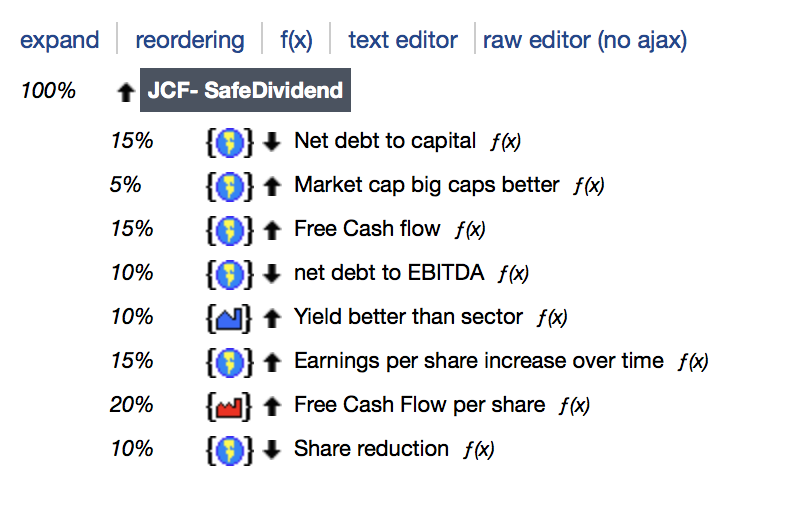
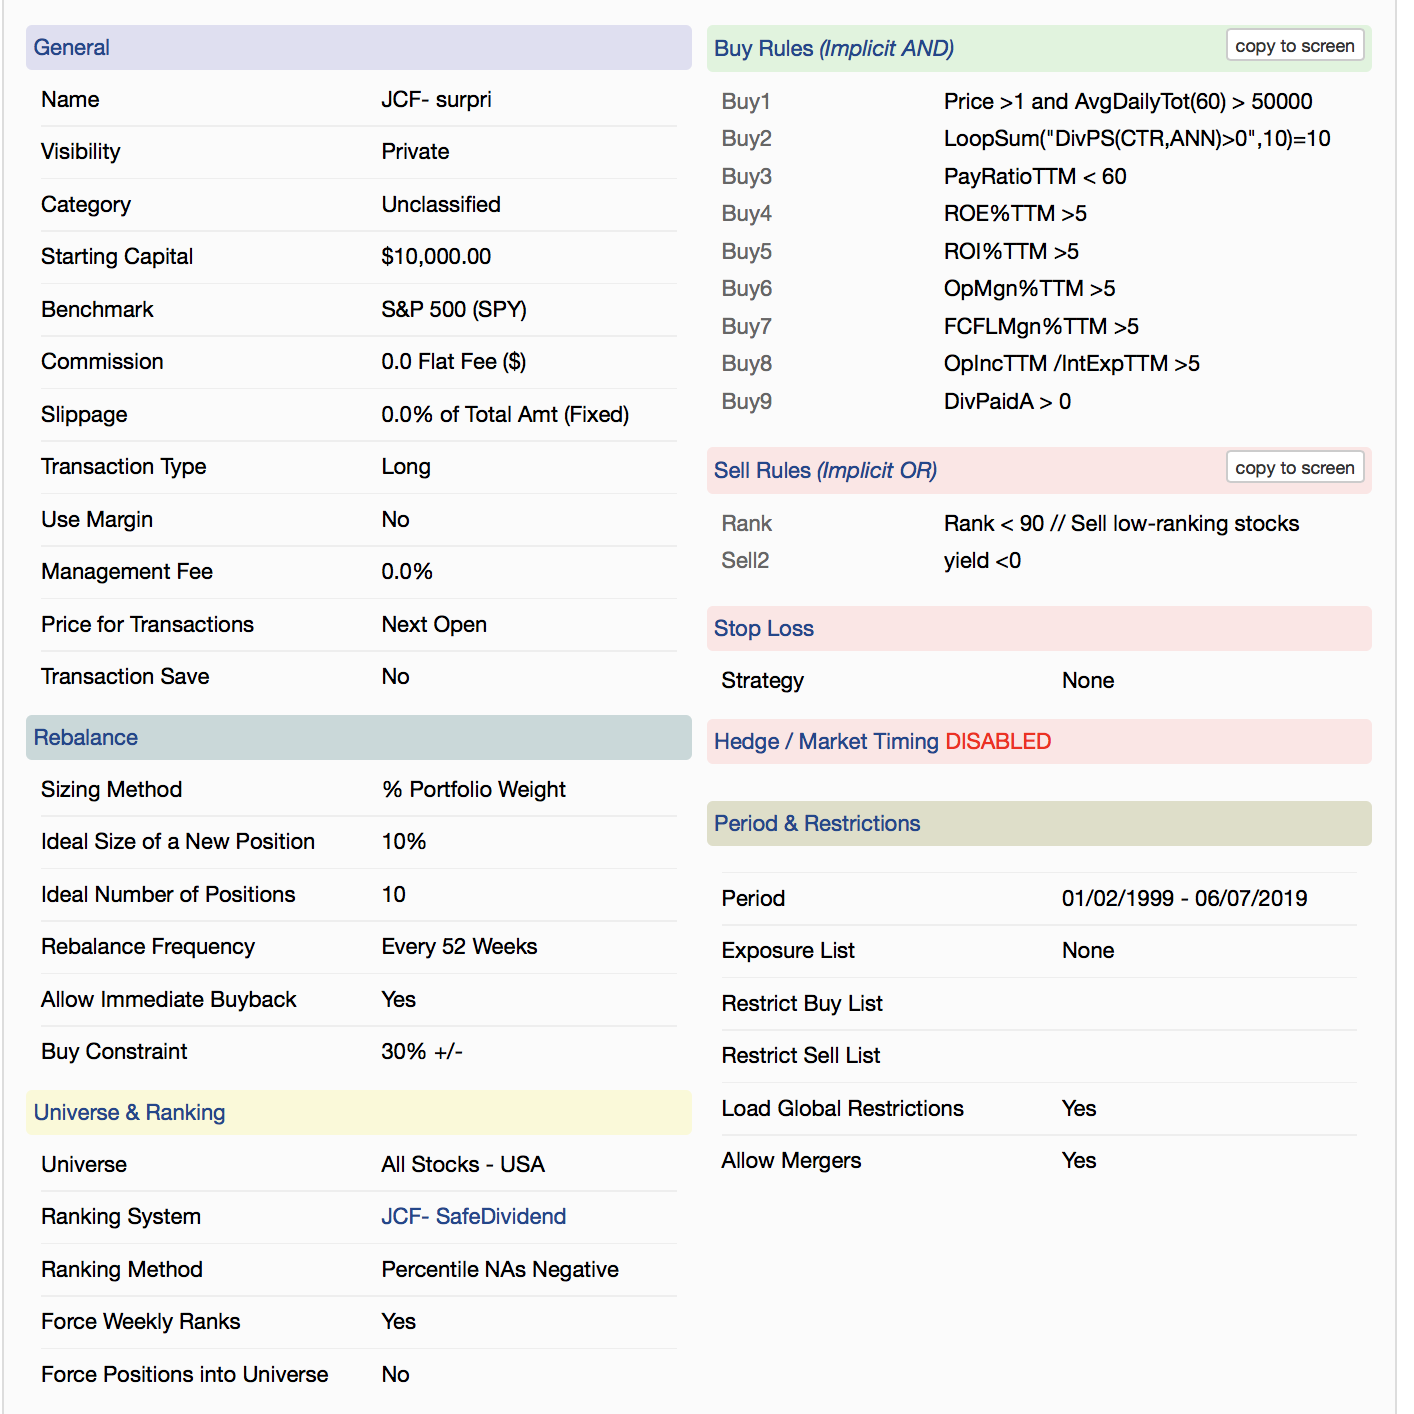
Then I created a ranking system for some factors, and I placed others in the buy and sell rules.

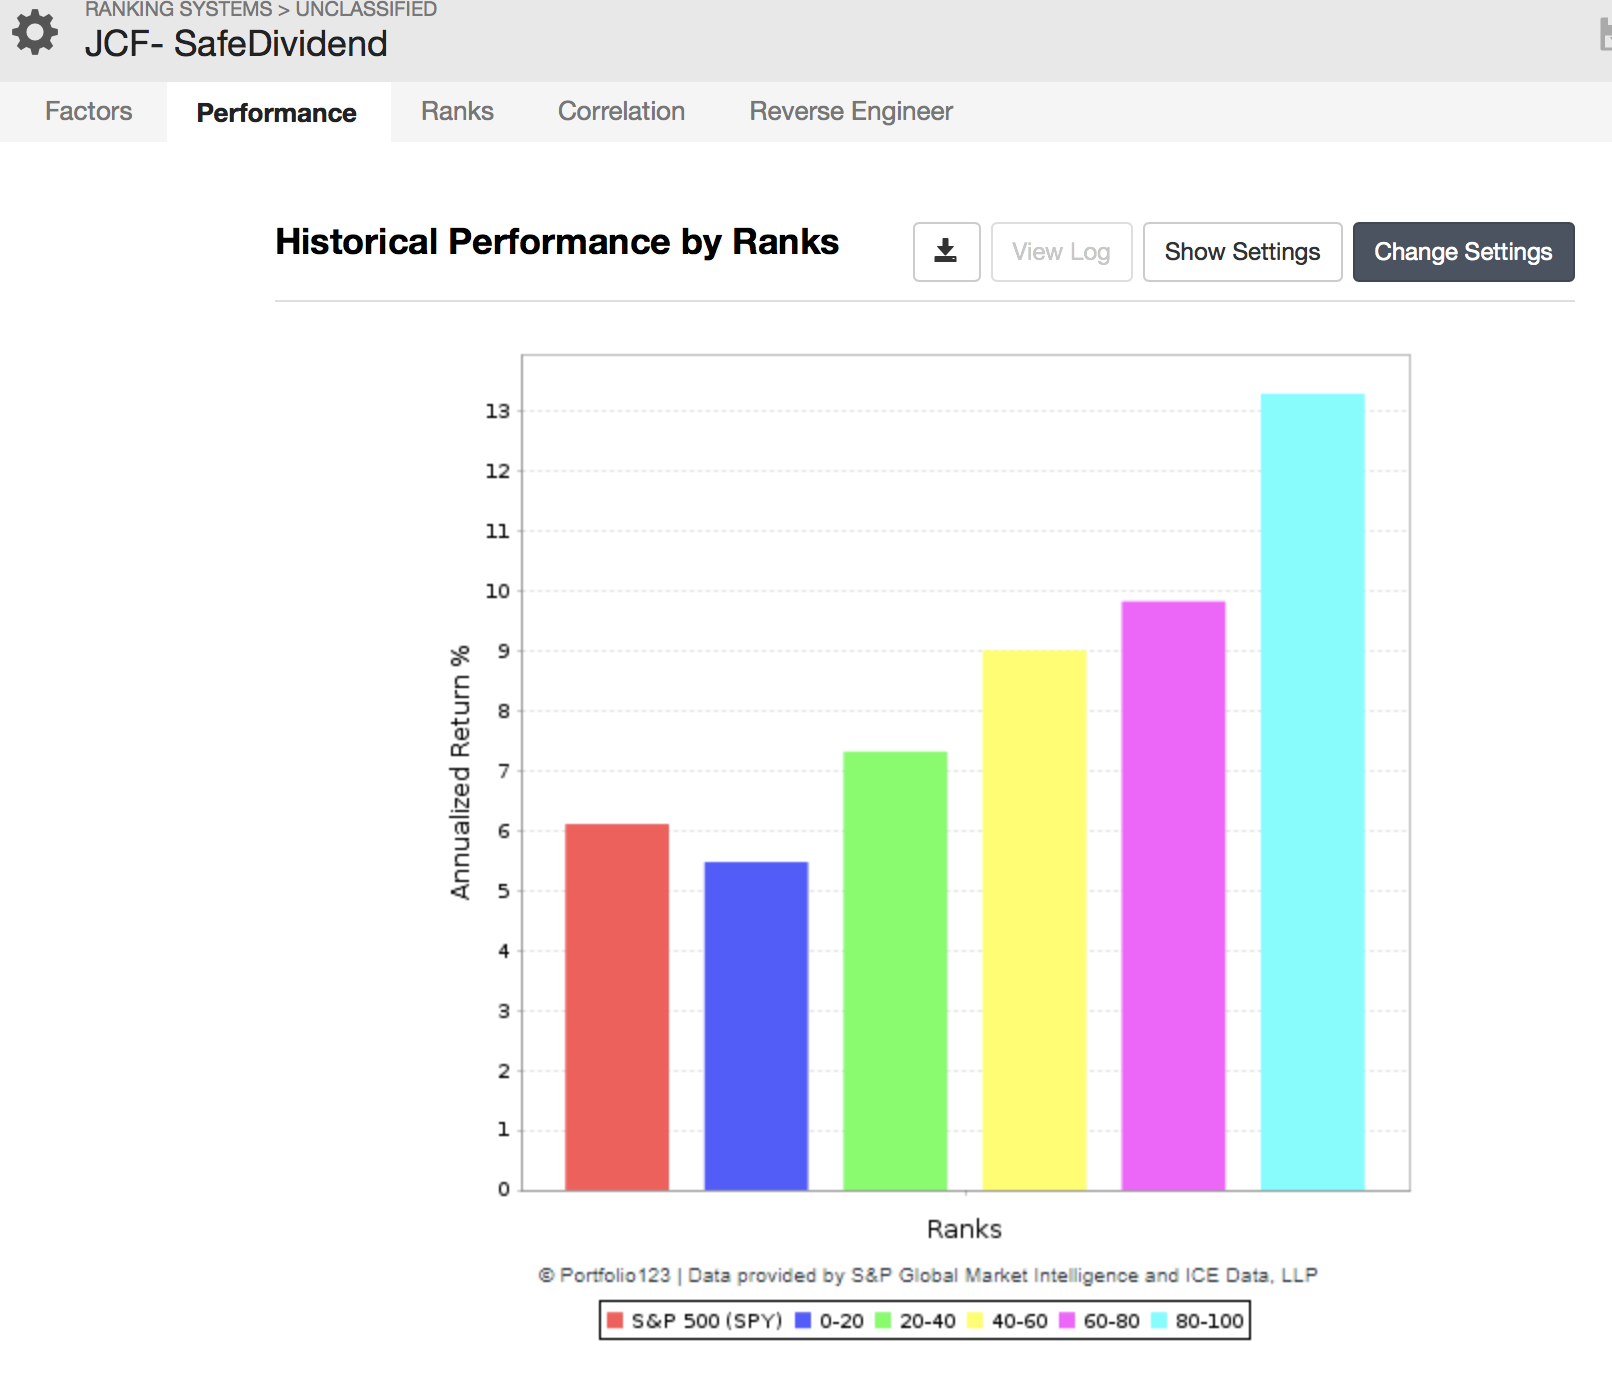
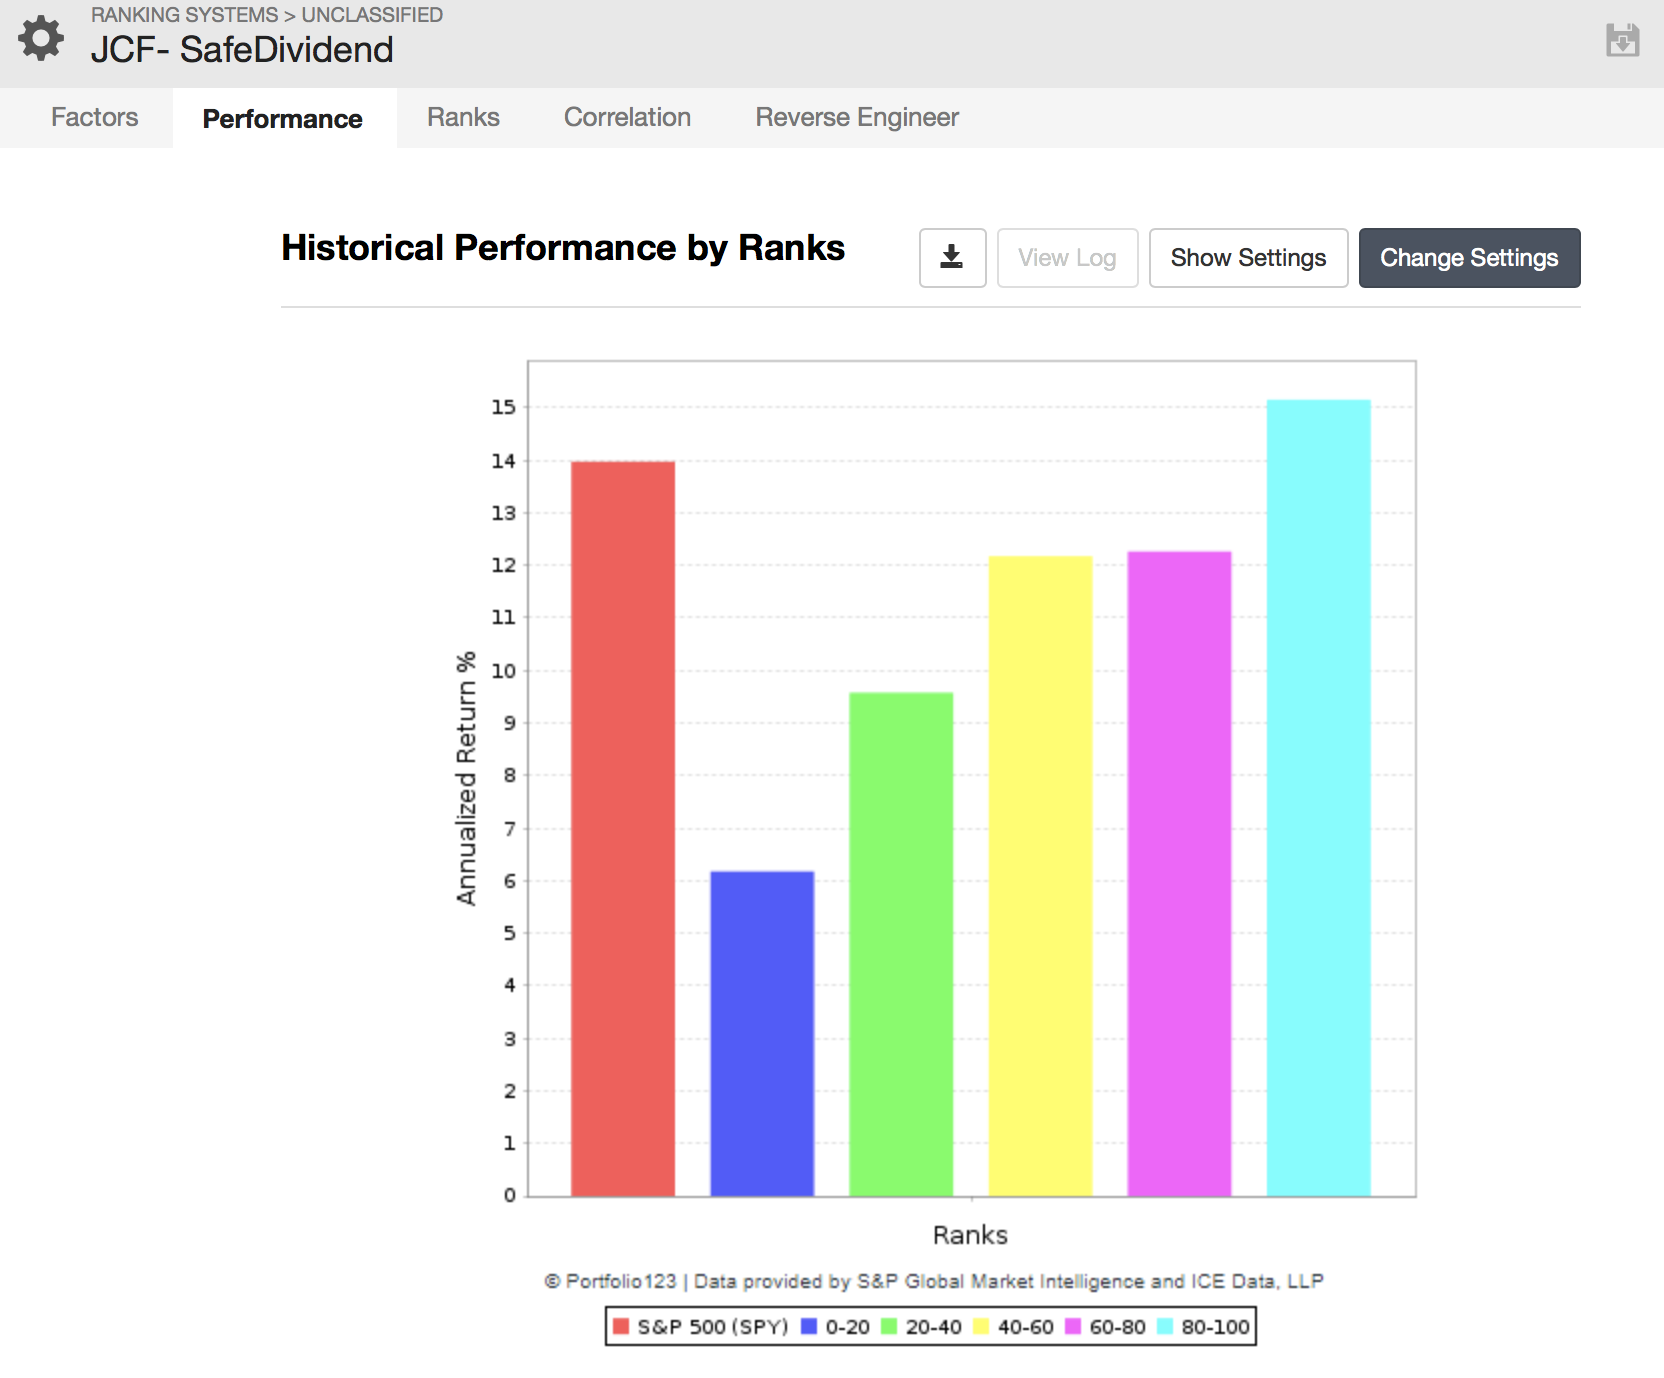
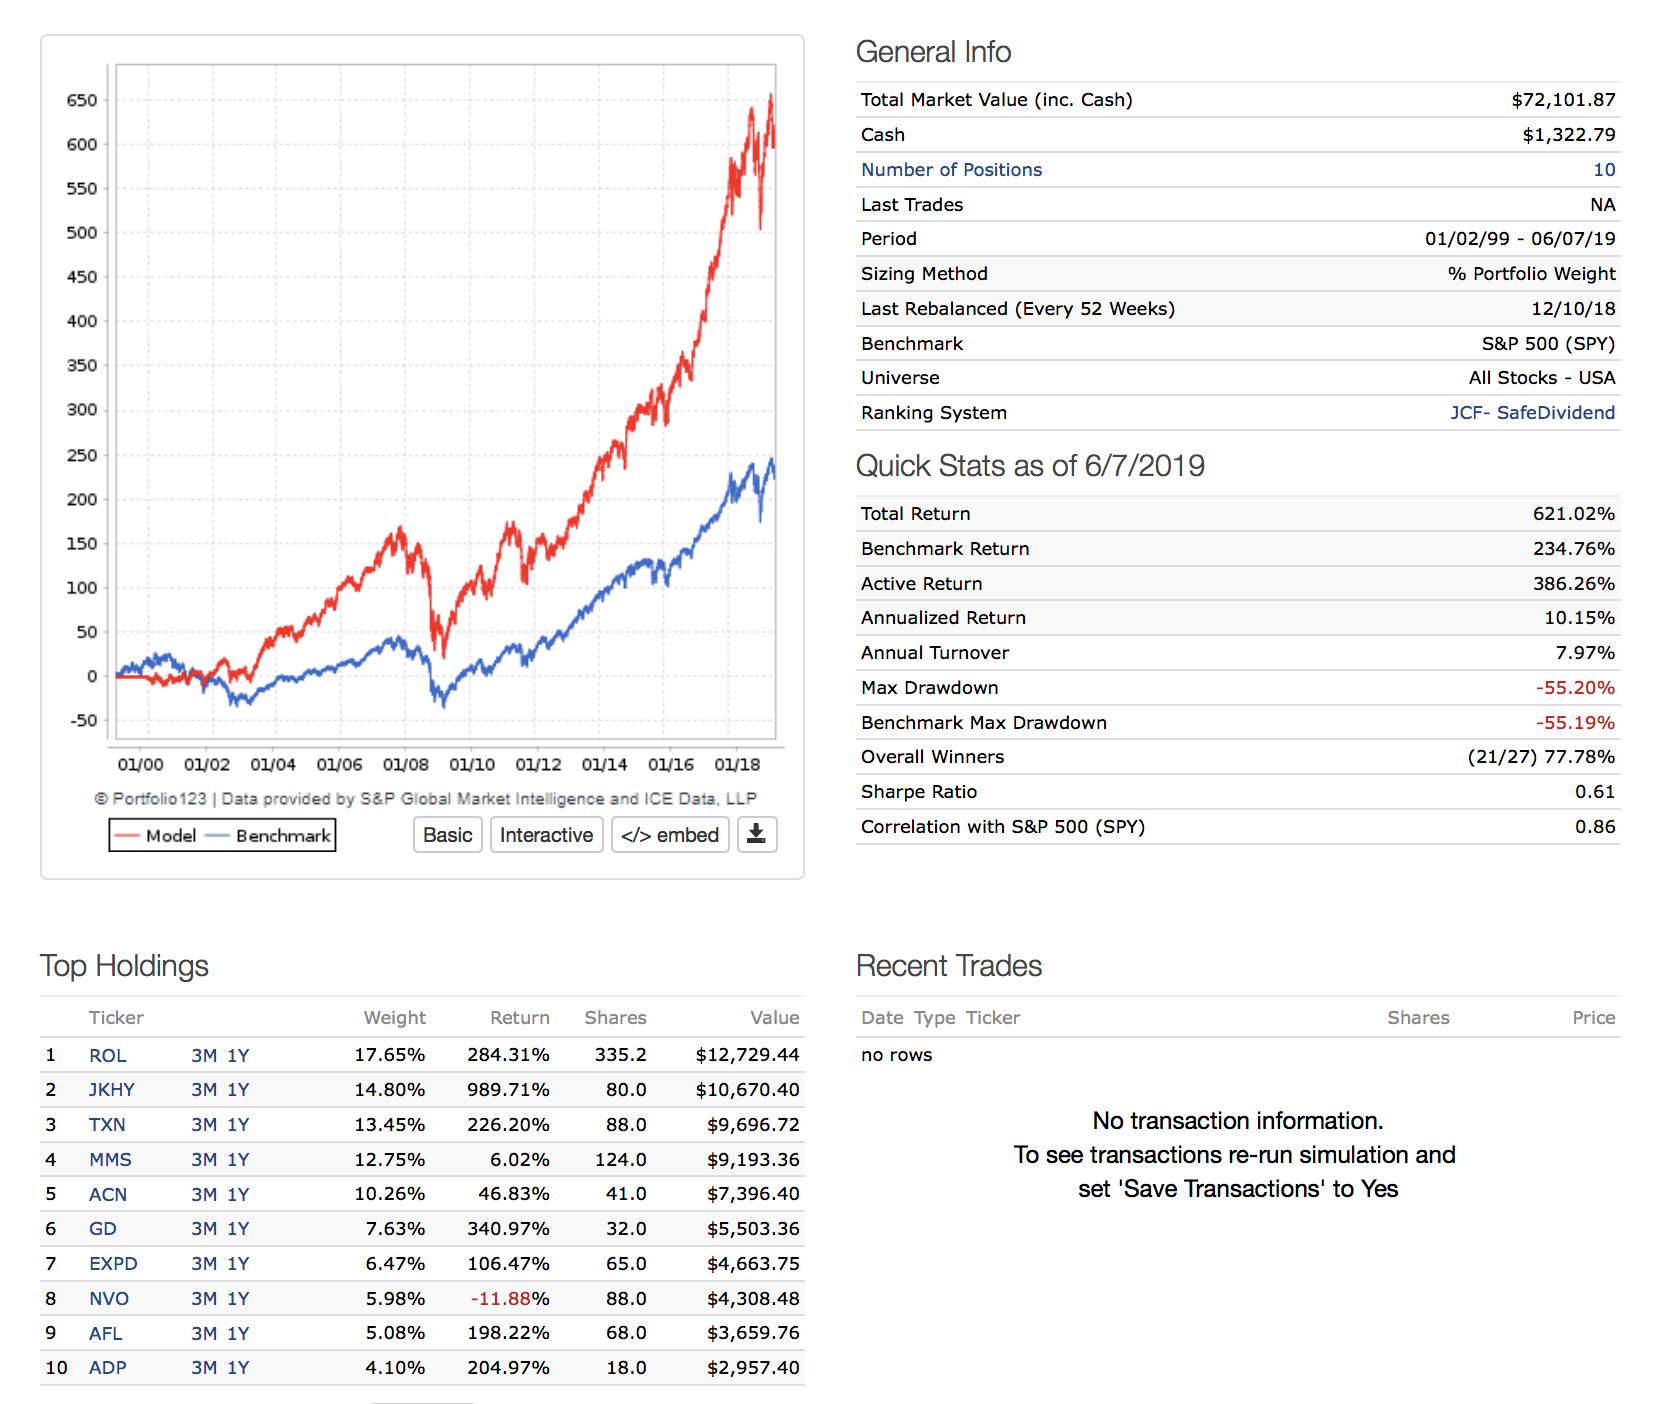
The ranking works very good in the last 20 years, but in the last 10 years not as good at it was.

And about the sim, if I follow the “rules”, the system it’s a disgrace, it underperforms the index a lot, I guess it’s because it’s too much demanding and there are no companies that matches the criteria, but if I relaxed the rules, and take out some of them, then it works more or less fine.

I would like to know your opinions about that sim and about the ranking.

Do you think it’s a good way to approach to the market?

Are the factors well distributed between the ranking and the buy and sell orders?

Thanks.


I had just a quick look at this but I think the sell rule should be yield=0 and not yield<0

As it doesn’t buy stocks in 1999 (I think due to 10 years of dividend data needed before buying), you should start the sim in 2000

I would also run a rolling period test with one month offsets and one year holding periods. See how it does. With so few stocks, so much slack in the sell rules and almost no turnover, the results are strongly tied to what stocks were picked up at the beginning of the sim. So it is telling you that highly ranked stocks purchased in 2000 are good ‘buy and holders’. But you probably want to find out if those ranks worked well if you started in 2001 and 2002 and 2019.

If this was me, I would probably stick to the same neutralization (all, sector or industry). I am not sure why some are industry when others are sector and mostly all. Is this just a result of switching them to see what works? As well, I would group the factors according to theme (put value in a composite folder, growth, earnings stability and so on). And then give each grouping an equal weight unless you wanted a stronger value tilt for instance.

I would also put in some sector weighting restrictions and raise the count to 20 stocks. That’s just me. Everyone has a different approach.

All the best.

I think this is a great start and agree with most of Kurtis’s points, especially about raising the count to 20 stocks. The one thing I disagree with Kurtis about is mixing universe and industry rankings–I think that’s appropriate in many cases (and when dealing with debt numbers, industry comparisons can be invaluable).

The “net debt to EBITDA” ratio with lower better is a tricky one to get right because a lot of companies have negative EBITDA, but simply reversing it will cause N/As for companies with no debt. I recommend doing something like OpIncBDeprTTM / Max(5, DbtTot) with higher numbers better.

There’s another thing to be careful of here, and that’s financial and real estate companies. These usually pay very good dividends, but their free cash flow and debt numbers are pretty meaningless. For financial sector companies, you really want to focus more on income than on debt or free cash flow. So you could set up conditional nodes or a separate ranking system for that sector. REITs are a whole different thing, and a separate ranking system for those might be useful if you want to invest in them. For those you really have to pay attention to FFO, and that data is unavailable prior to 2006; FFO applies only to REITs and is N/A for other companies.

1 Like

I don’t disagree with using different neutralizations if you have a reason to do so beforehand. But if you are just toggling settings and running sims to see what works better, then you are better off leaving all at one neutralization. I see too many ranking systems with weighting’s tweaked and using odd neutralizations for no other reason than ‘it made a good backtest’.

Thanks for sharing monday33.
I would also do rolling tests and test it on smaller periods 3/6 months

I’m also generally not in favour of having so many buy rules. You make this long multi-factor system that ranks stocks and then you “trump” it with stricter buy/screen rules. You would probably lose out on a wonderful stock with a rank of 99.9 that just happens to have an ROE of 4.99%.

Thanks to all of you guys for your answers, you are great!!

So, let’s go by parts;

Hemmerling:

  • In the rolling test, do you mean to set it like “sim period: 1 year” and “offset:one month”?
  • Then, what statistic do you prefer? Alpha? %winning days? What is more important?
  • I do not understand what is “neutralization”… I compared the Rank Formula Result vs Stocks in its industry/sector/universe just because I feel it was the correct but with not a good reason in particular. I think I do not fully understand this.

Yuval:

  • Why do you prefer 20 stocks? I like 10 stocks because it’s more closer to what I want for my portfolio, because it’s cheaper and also easy to stay aware of them.
  • I did what you said in the ranking, place that formula: OpIncBDeprTTM / Max (5, DbtTotTTM), Is the same that net debt to EBITDA?

Nisser:

  • I understand what you mean, but the sim it’s just a experiment to see what happends with the rules that people have in their analysis. Next move is to try to improve the sim, probably erasing some of the closed rules.

Yes. Setting period to 1 year and Rolling Offset to 1 month would be fine.

In general what I look for is the consistency of out-performance. Overall, this sim beats the market by a 6% compound annual growth rate when fully invested. What I would love to see is for the period excess returns to stay at 6% for the entire chart. But you won’t see that. What you want to see is how consistent the excess returns are. You will also find out (because turnover is so low) whether the 6% excess return stays at all. You might find out that on average the excess returns are 8% annually or in some cases negative. For simplicity sake you can look at the average alpha or you can make a new column to derive excess returns only and find the average. Another thing to watch out for is falling excess returns. Was your average out-performance 20% annually for the first 10 years and then fall to -15% for the next 10 years? Is the excess return increasing, decreasing or staying the same? Since the backtest is over such a long period, an extreme one time out-performance in 1999 and 2000 could actually create the illusion of a great sim but where the excess returns have sailed long ago.

What I mean by neutralization is just which group you compare your factor against - market, sector or industry. In some instances I prefer to use the market and particularly when using technical signals such as mean reversion or volatility. In general I prefer the compare value ratios and such against the sector so that I am not just piling into utilities - unless that is my intention. I use industry comparisons rarely except in rare circumstances such as a certain healthcare only ranking system I run. My only point was to think in advance about why you are comparing it against a certain group. Rationalize first and test second.

10 stocks provides you with very little data. The more data you have, the better your out-of-sample results will reflect your in-sample results. If you do a rolling backtest on 50 or 100 stocks and it really works well, then you’ve processed a lot of data and you can be much more sure that if you narrow it down to 10 stocks it’ll be OK than if you only backtest 10 stocks to begin with.
And yes, that formula will give you the same as net debt to EBITDA but you must use higher values better because it’s more or less reversed.

Hemmerling:

Got it. Thanks a lot for your explanation, it helps me a lot.

Yuval:

Got it too. I love your formula, I will try. Thanks a lot.