Pabrai Free Lunch.

Hi all.

Here I’m cheering up the forum again.

Just I would like to comment that few days ago, surfing on the net, I had found the Monish Pabrai web page* where he “offers” a free “buy list”, based on a sim he made about companies that repurchase their own stocks “aggressively” (whatever that means).

*2019 Free Lunch Portfolio - Chai  with  Pabrai

I though, ok, let’s go, I will replicate the system.

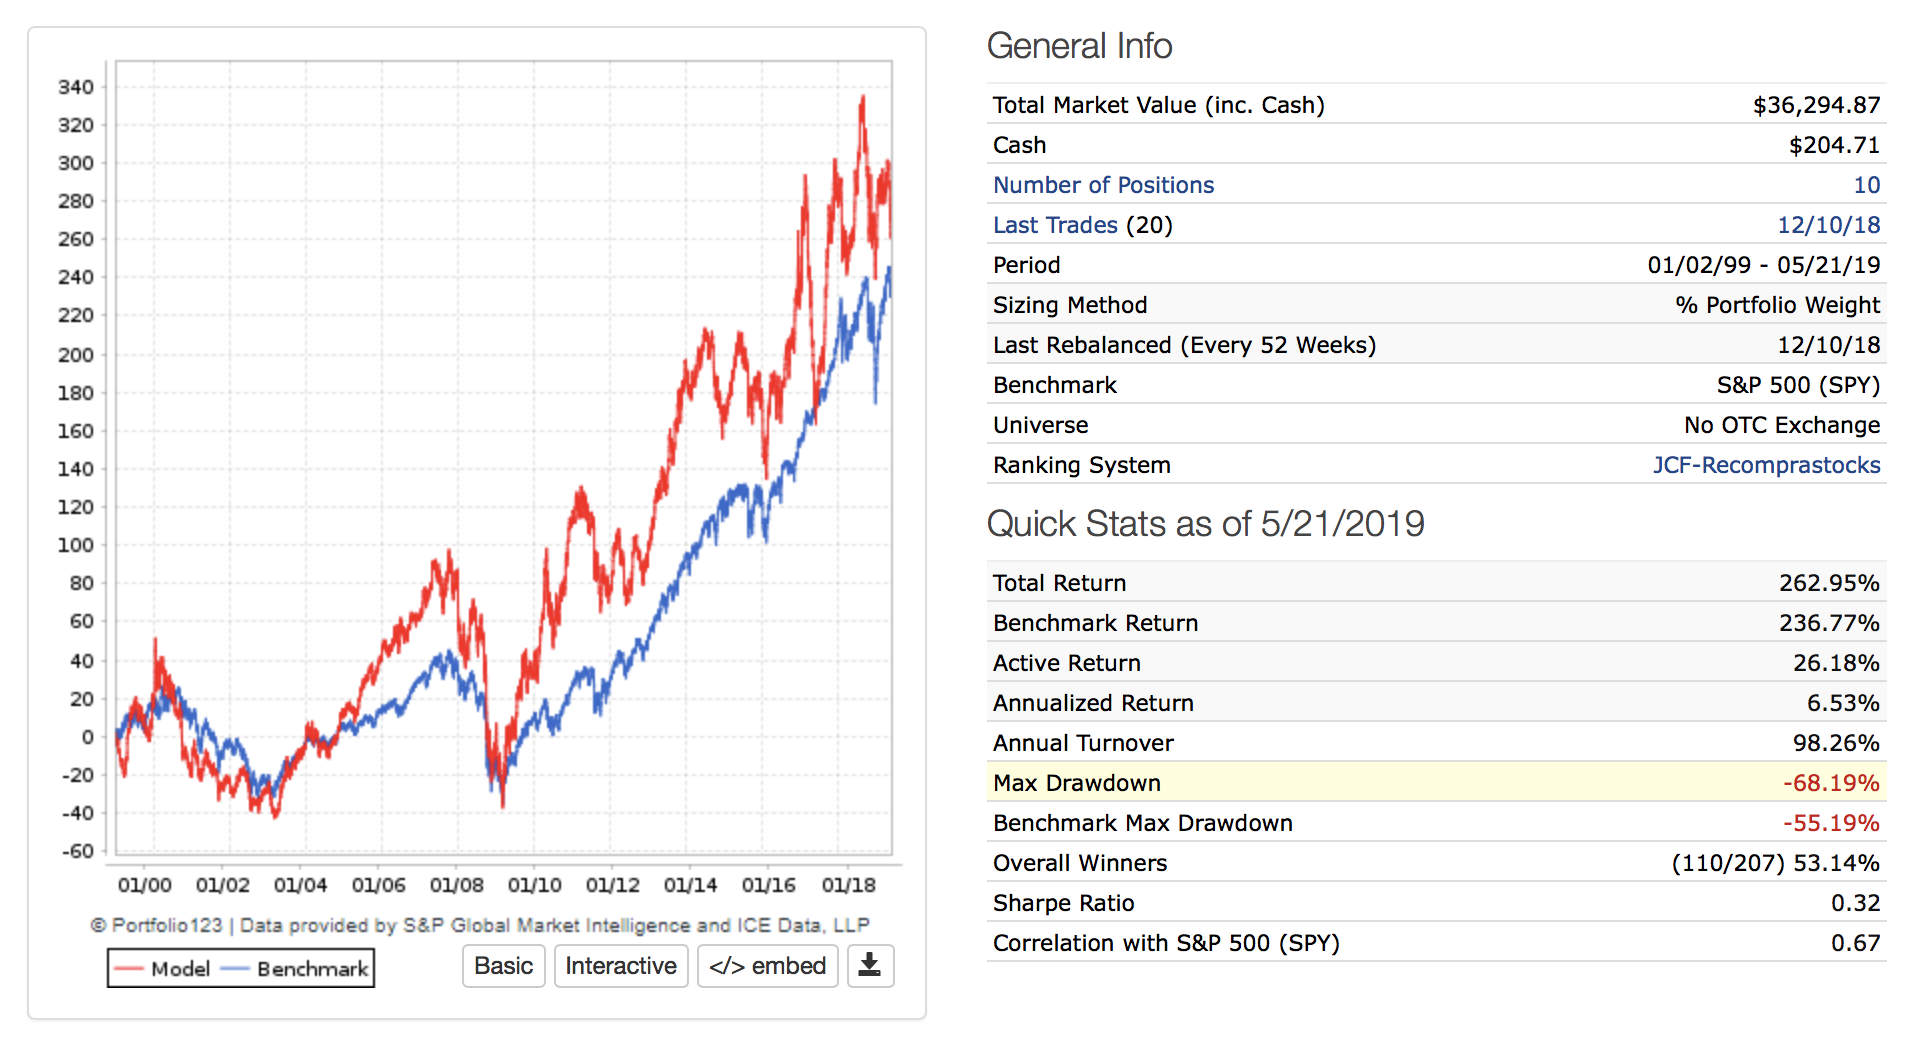
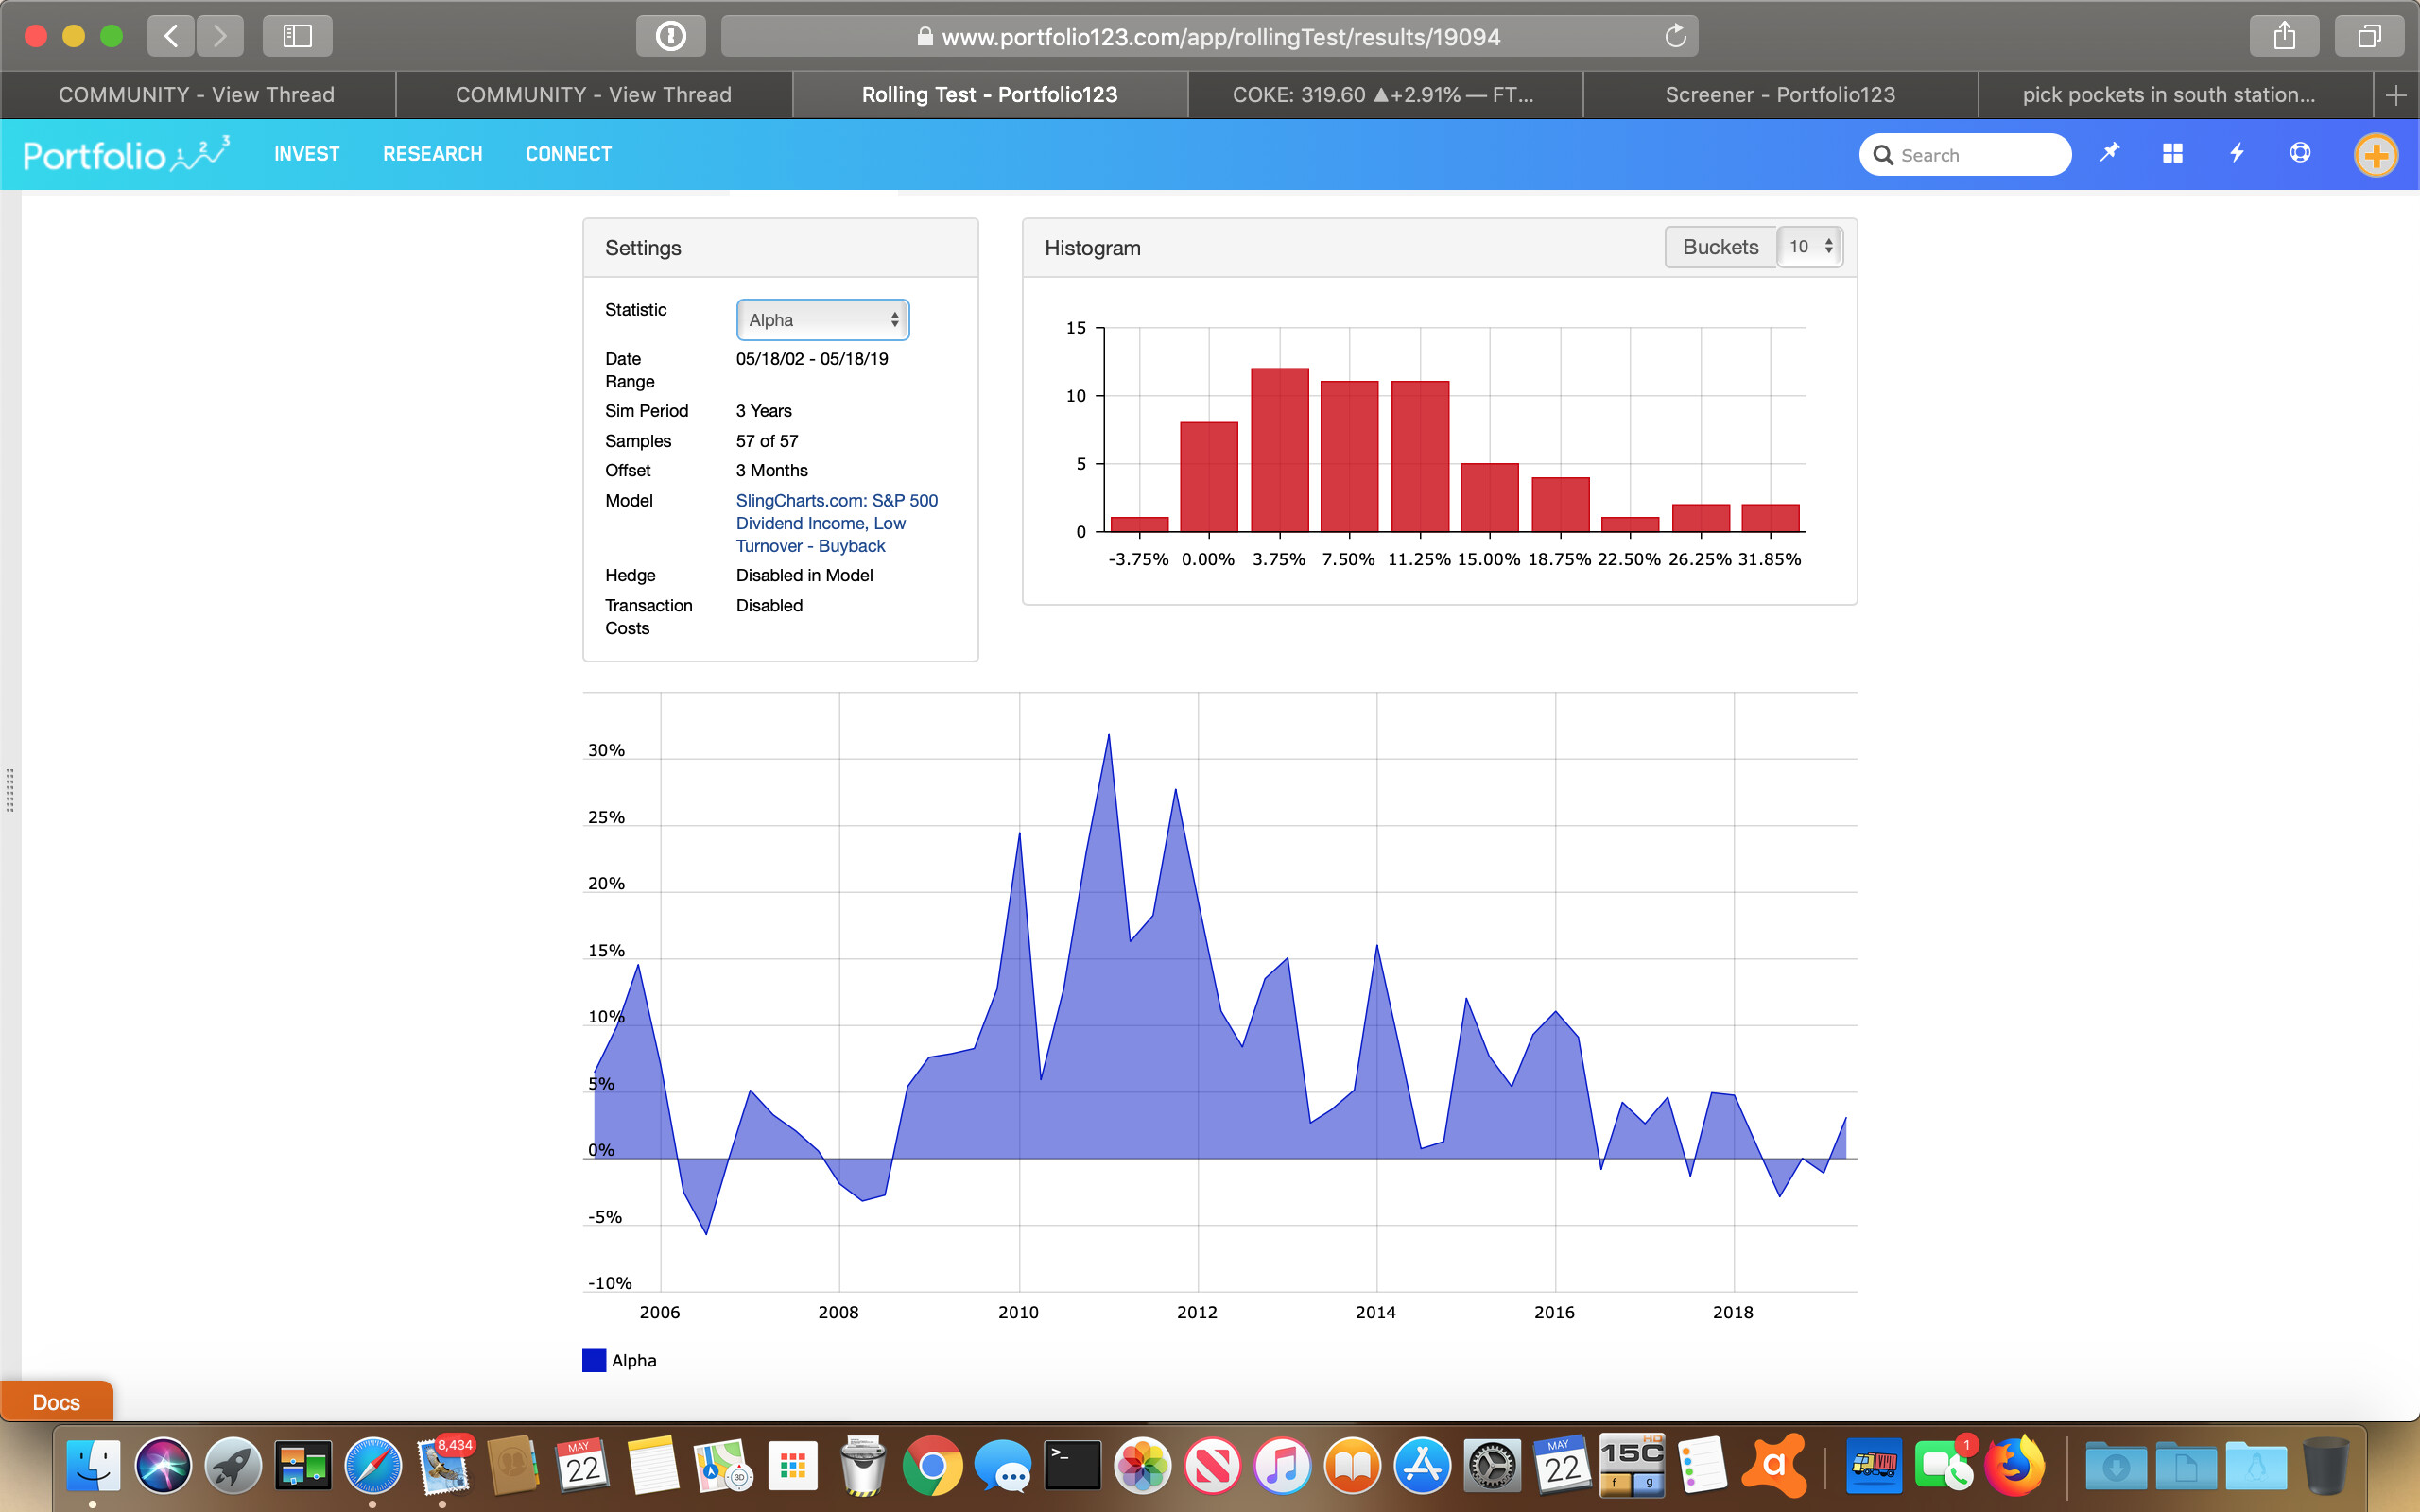
But I did not succeed. In fact all what I tried goes very far away from this 17% performance Pabrai says his system have. And, by the way, the tickers Pabrai listed do not appears in my results, none of them.

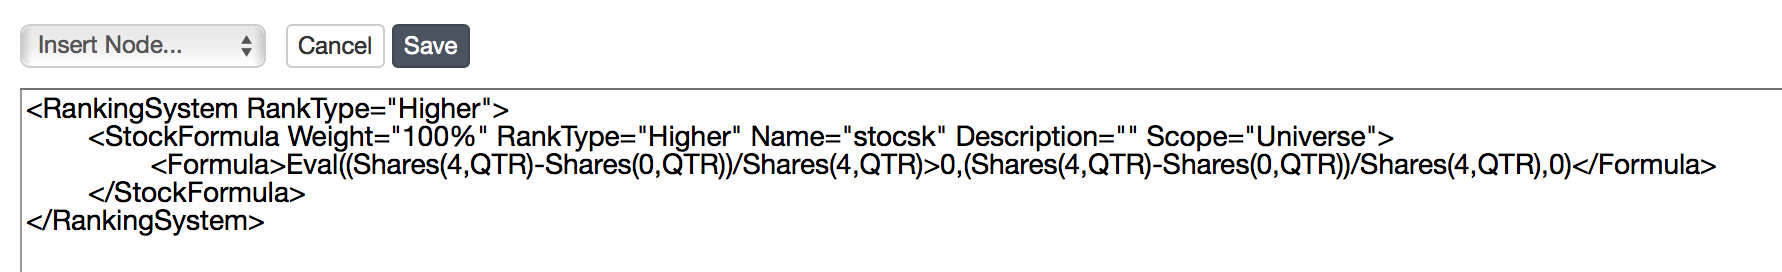
I tried with the following commands, in both the ranking system and in the “buy rules”, one at a time…:

ShsOutAvgTTM * 0.95 < ShsOutAvgPTM

Eval((Shares(4,QTR)-Shares(0,QTR))/Shares(4,QTR)>0,(Shares(4,QTR)-Shares(0,QTR))/Shares(4,QTR),0) - for the ranking

FRank(“Eval((Shares(4,QTR)-Shares(0,QTR))/Shares(4,QTR)>0,(Shares(4,QTR)-Shares(0,QTR))/Shares(4,QTR),0)”)>95 - for the buy rules

(ShsOutAvgTTM < (1 - (3/100)) * ShsOutAvgPTM)

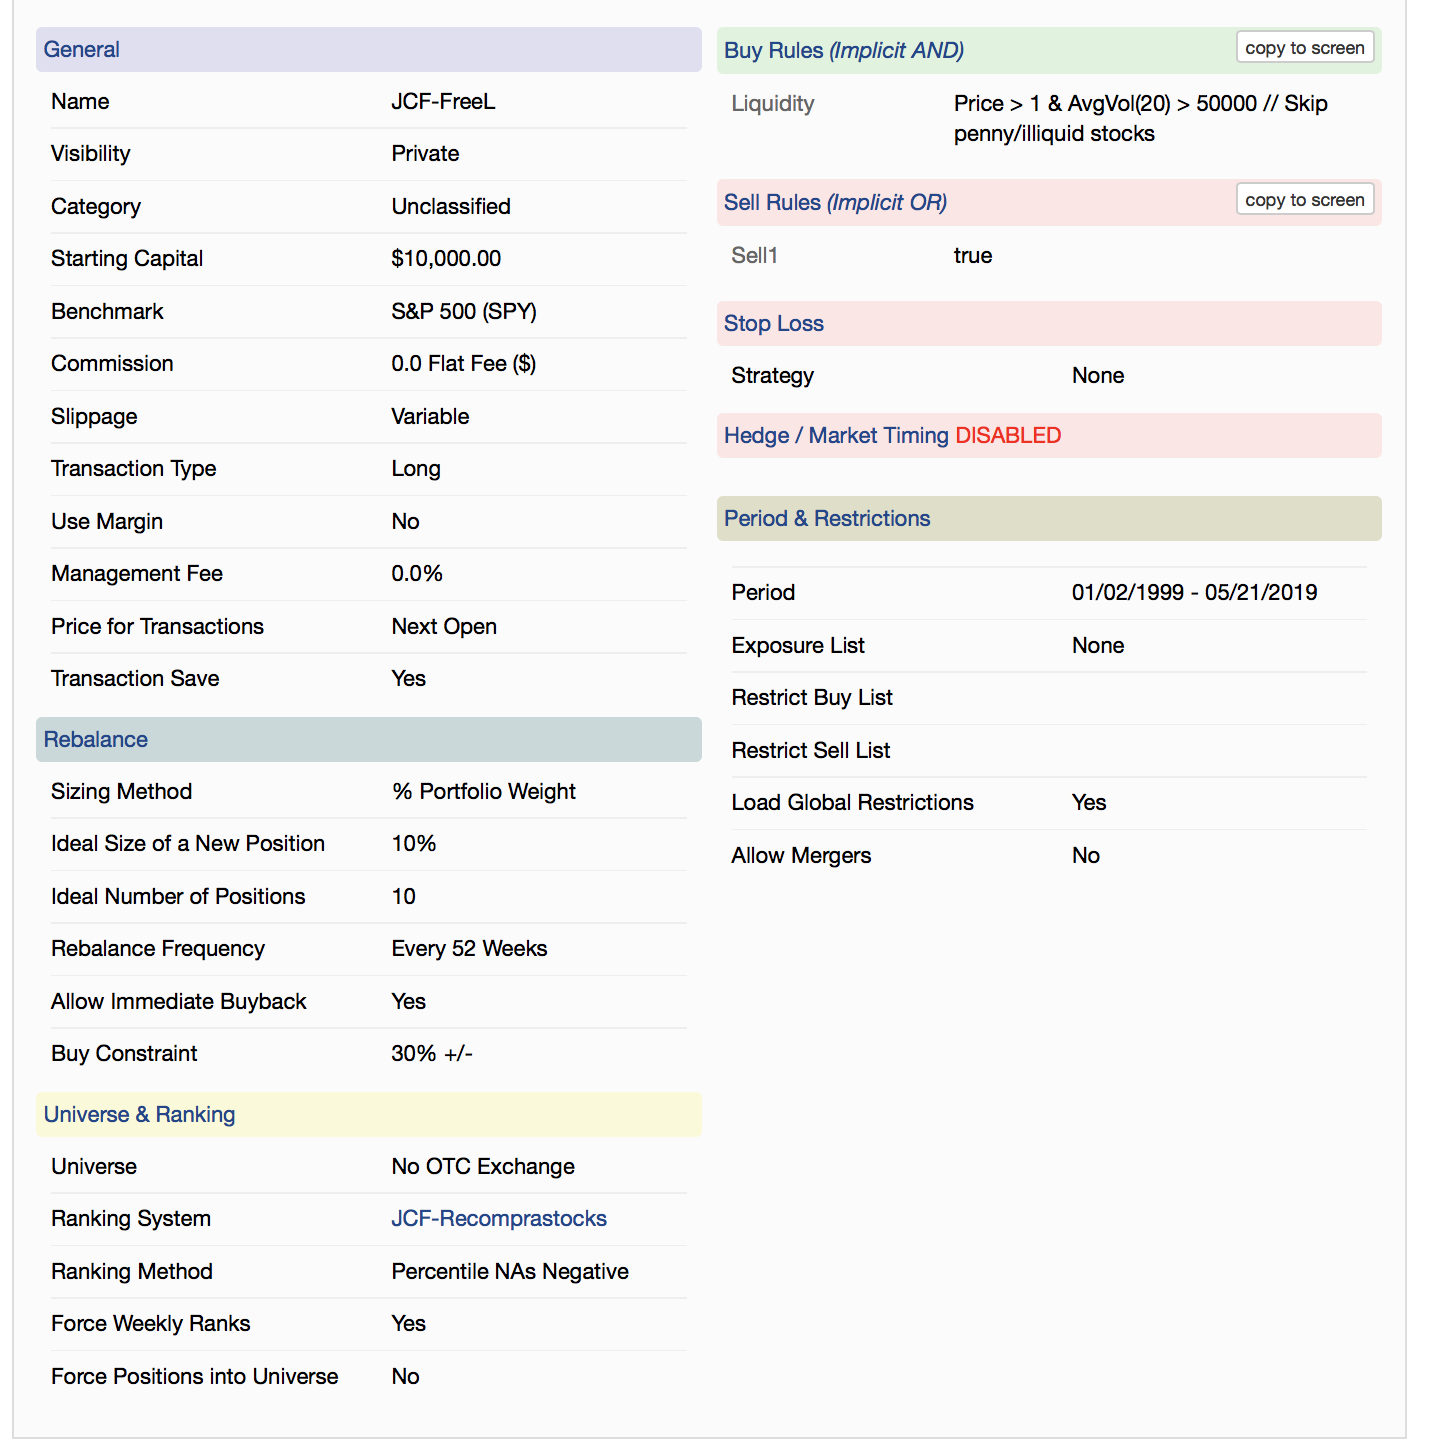
In my sim just there are some liquidity rules and not so much. I attached here my last try.

And now I’m dried of ideas. I do not know if there is more in their system from what he says, or I’m not doing things right, or whatever…

Any ideas?

Thanks.


The first thing to state is that we do not support getting the same result as any external site. I know that Portfolio123 seems to just be crunching some publicly available numbers and returning the result, but in reality there are lots and lots of little decisions that go into every choice that the system makes. If another site makes different decisions then it’s going to get different results. We can’t see their decisions, so there’s no practical way to get results to match. (Also, they may be using a different data set.)

That said, looking at Pabrai’s stuff, I would not be surprised to discover that he’s a P123 subscriber. :slight_smile:

In Janet Novak’s original Forbes article he gives some more rules. I put them together in this screen:

Uber Cannibals

A few notes:

First, I’m assuming, based on the way that he seemed to be talking, that he is using the S&P 500 as a universe. I could be wrong. When doing so, his requirement of 20% five-year revenue growth becomes extremely restrictive. The return looks really good, but the system will frequently hold fewer than five stocks and is sometimes in cash for a year. It’s restrictive even when using All Fundamentals.

Also, the requirement to hold five positions seems to make it very dependent on the starting date. His stated reason for using March 18 is nonsense. Calendar-year companies indeed must have their audited financials out by then, but companies don’t have to be on the calendar year. This strategy will never hold any retailers.

Backing off the five-year revenue restriction to 10% and running it off of All Fundamentals looks like this:

Uber Cannibals Modified

I invite you to play with it.

Whoops, just realized that this is only one part of the strategy that you’re looking to replicate. BRB with more.

And that was fast. We can’t do the other two components because we don’t have the data.

Here’s a version that looks at share reduction over a 5 year period; https://www.portfolio123.com/app/screen/summary/227909?st=1&mt=1

And there appears to be a steady decrease in alpha since about 2011.


Wow… clearly I needed a lot of information more than what I had. And, yes I know that we have no data on the “other” two systems. I wanted to work just in the first one anyway.

Thanks a lot for your help Paul, you are so kind!!!

Yes, that’s very interesting. We are surrounded, in some strategies, by alpha decay since 2008. It appears everywhere. It’s very interesting and give a lot of room to think about it.