Variable Overview

Do users have suggestions about the most effective ways to get a feel for specific CompuStat variables? Examples of what I think might be useful are…

Is there a way to see the distribution of a variable’s values over a defined universe during a specific period of time?

To judge how a variable’s distribution might have changed over the years?

To quickly determine how much data is missing and when?

This one may be the hardest: To judge when the data might have been less reliable?

Thanks very much.

Hugh

Testing for NA in the Screener backtest can show missing cross-sectional data in the number of positions held count. Just setup the test to hold a stock when the factor=NA (e.g. TanBVTTM=NA, plot attached).

I think your first two inquiries would require 3-axis charting and that’s not supported by p123.

Walter


atw, I don’t know if this will be helpful, and I suspect it’s not very efficient (it’s manual and seems tedious to me), but a while back after listening to a podcast with Rob Arnott discussing variation in factor valuations over time I built a process to look at the valuation ranges of the top deciles of various rating factors I use. (I use “factor” in this context to represent my composite for “quality” or “value” or “volatility” or whatever).

Essentially I was looking to understand if “factors” are historically expensive or cheap. I think professionals probably do this by comparing the spread of top quartile to bottom quartile, or something like that, but I was just loooking at valuation metrics of top 10% of securities for each factor, filtered for my test universe.

  • I setup a screen report with valuation metrics.
  • Stuff like Earnings Yield, PS, EBIT/EV , or whatever metrics you want to utilize to measure variation over time.
  • There’s a key limitation in that the screen report will only export a limited # of columns. I ended up using 2 screen reports, but would not recommend as there’s alot of clicking and the process can induce carpal tunnel
  • In my screen, I’d load the ranking system “factor”, and set the rule to Rank>90 so I’m getting stocks in the top decile.
  • This was done at 6 month intervals (wider intervals might be fine) - so iterating through Jan 1, 2005, Jul 1 20005, etc…
  • I’d dump the screen report for a date and factor into an excel (copy-paste I think) that was designed to calculate the median valuations for each of the selected valuation measures, (like EarnYld, EBIT/EV). In hindsight, I wish I would’ve not only calculated the median valuation level for a factor, but also set up calculation to grab the 75th and 25th percentile and archived those also because it would’ve been very little extra work if prepared in advance.
  • A short macro was setup to allow quick copy paste of the various valuation measures into the historical timeseries sheet. (Once the process is defined setting up macros will make it flow much more quickly, but still a grind).

So at end I had a time series grid looking something looking like this… (again, it would’ve been so easy to add calcs for the 75th and 25th percentiles of valuation and archived those simultaneously also, but I failed to do that).

Quality Median 1.05 7.05 1.06 7.06 …
Earnings Yield xx xx xx …
PS xx xx xx …
EBIT/EV xx xx xx

My conclusion at the time was that the value factor is in fact pretty cheap right now (confirming reports) - but I found also some of the other factors seem to be in reasonable ranges. I was concerned that some of the factors I was using might be at extreme expensive ranges, but that wasn’t my conclusion.

This process could be adjusted to export other factors besides valuation metrics. A count of “NA” could be added to excel calculation and collected similarly. I’d also think measures of measures of variation like std dev might work also, or at least ability to see spreads between various percentiles.

Anyhow, I don’t know if this helps at all, but I wanted to pass it along as it sounded like it might be similar to something you’re wanting to look at.

Some heuristic assumptions I use about the distribution of the data include:

Longitudinal/cross-sectional Prices: lognormal

Longitudinal/cross-sectional Log returns: normal

Longitudinal earnings: skew-normal

Longitudinal revenues: lognormal

Ratio distributions of traditional value ratios (e.g., P/E, P/S) are generally approximated with inverse Gaussian distributions. I believe yields (e.g., S/P, E/P) can be loosely defined by Cauchy distributions.

These assumptions convey how the data behaves in terms of expectations, extremes, asymptotes, and undefined values.

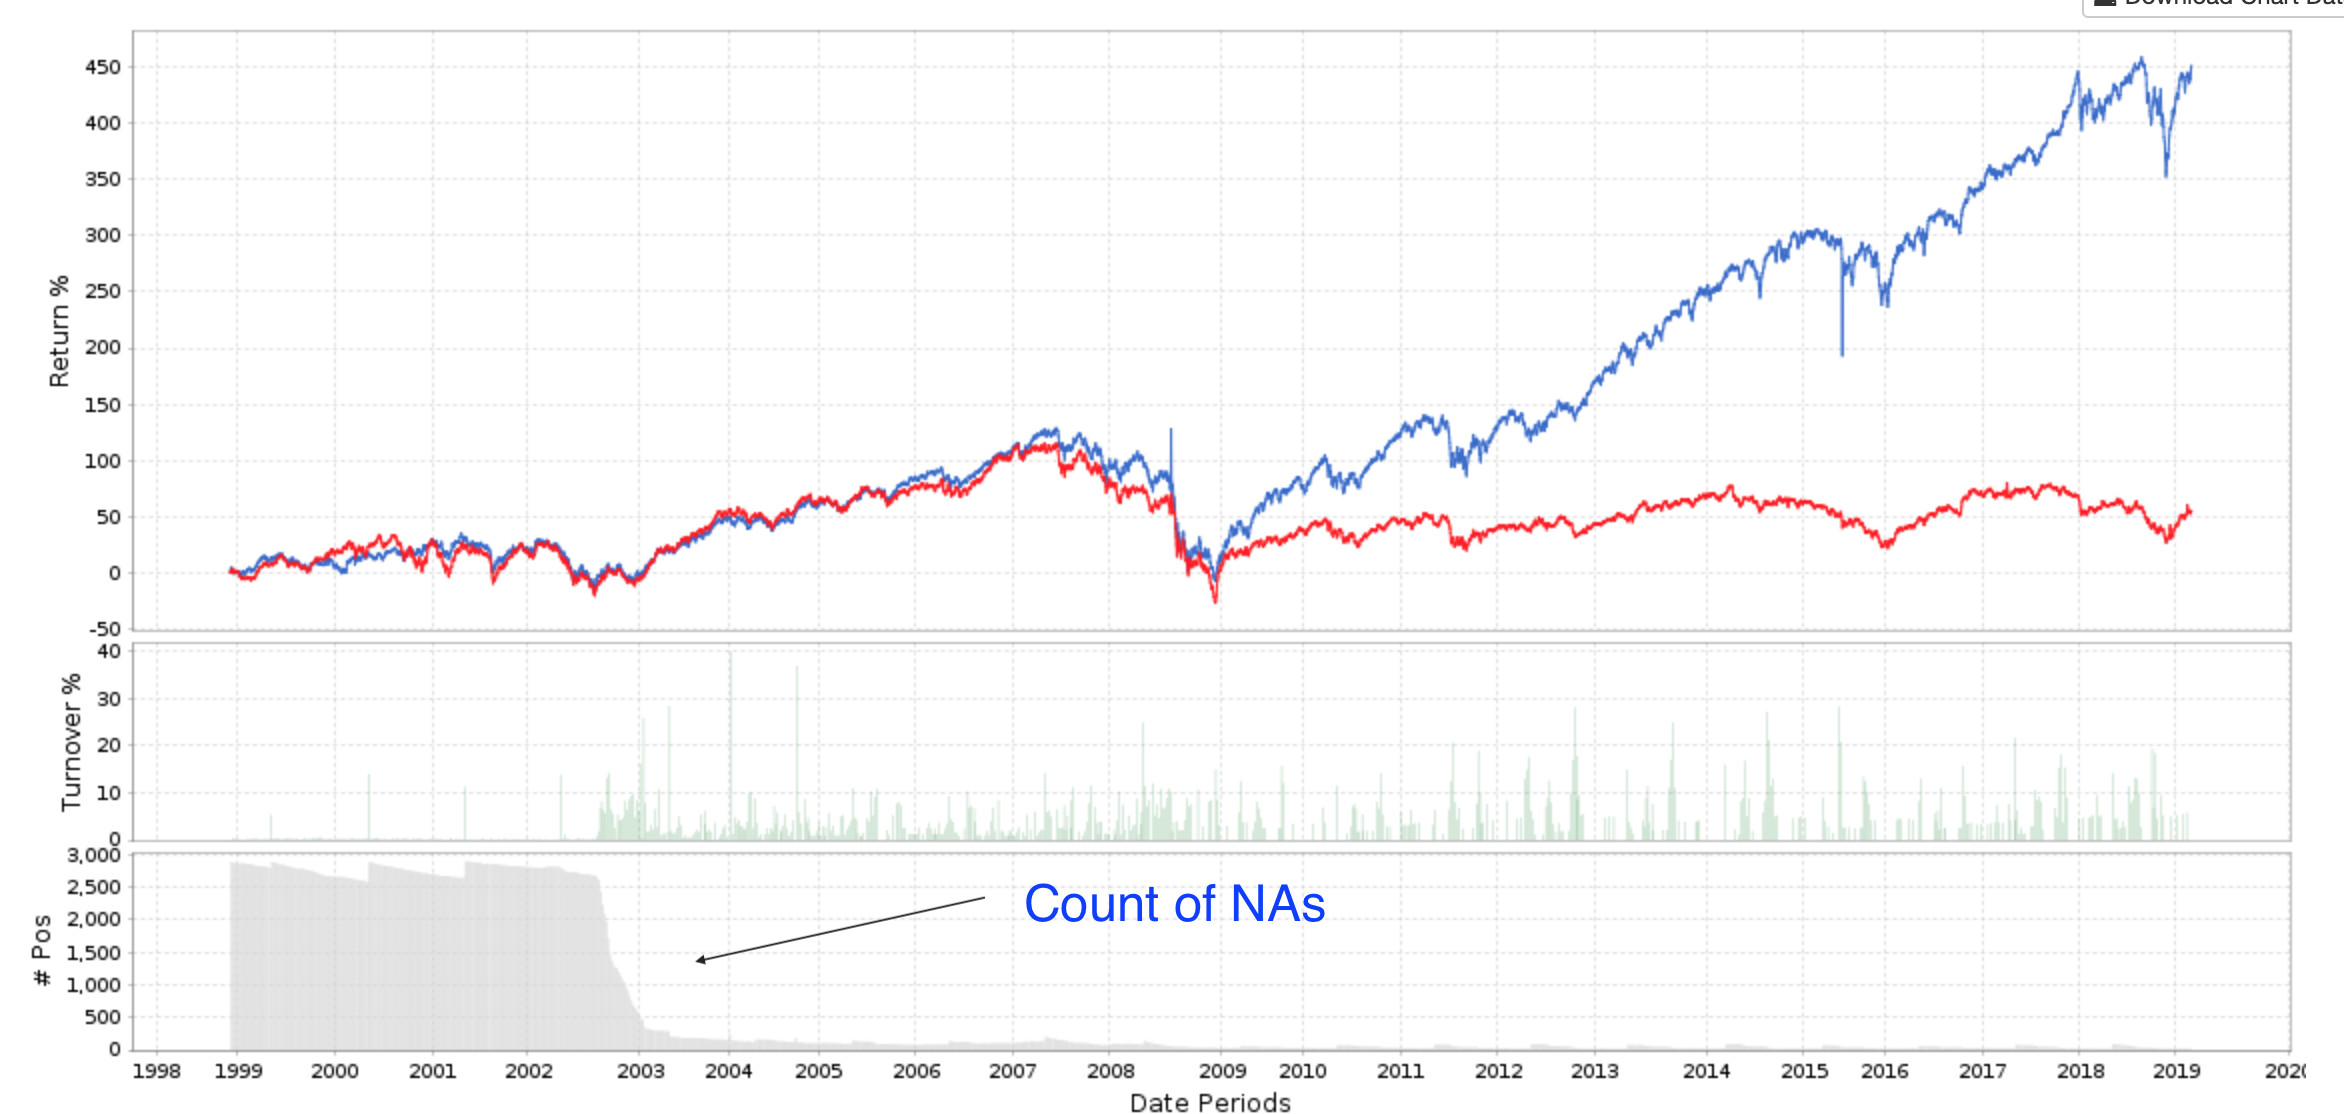
They do not say anything about NA or Null value handling

For the error handling discussion, I think you might benefit from spending some time in the CompuStat documentation. Most schools with business programs will provide access.

Once mastering CompuStat’s core logic, it gets a little trickier in P123. P123 is doing some additional interpolation of the data. This facilitates its use, but makes it more difficult to unwind the presentation of the data. Moreover, P123’s core logic relies on matching/manipulating based on dates; we are limited in how we can natively interact with dates through the front end.

Anyway, once I reached this point, the reason for P123’s back-end logic of falling back, keeping NA, and date-period matching made much more sense.

Walter, Spaceman and Primus,

Thank you very much for your quick replies, which are both thought-provoking and helpful.

It seems to me when running simulations that there shouldn’t be any downside to greater familiarity with the underlying data, and maybe every once in a while it could be very useful in terms of choosing variables that are more robust because they are perhaps less prone to outliers and/or missing data. I think it’s a given to study the underlying data when creating statistical models, although often hurried or neglected, I’m sure.

Given how well p123 does so many things, I’m guessing that some basic data profiling wouldn’t be impossible to create.

I wonder if I could point this discussion toward feature requests in this regard? It’s clear from the replies above that anything I would advance by myself would be less interesting and sophisticated than if we could consider this together.

Thanks again.

Hugh

I’ve found submitting feature requests a waste of time. The community response is usually tepid and that’s OK, I guess. But there’s usually no response from P123 and that’s not OK. I’ll be on sabbatical from that activity for a while. Best of luck.

Walter

Did you try Data Views - allows you plot cross-sectional distribution for a given date
Unfortunately does not allow you to pick universe

Apologies as I just answered my own question by changing the entry regarding Max # of Stocks on the Settings page…

Walter,

When I tried to run a backtest in order to count NA, I ran into “Error: Max Pos % is too small for the requested Max No. Stocks.”

Obviously you were able to work around this. How did you do so?

Thanks very much. I think this was a great idea.

Hugh


Put zero in the max pos field.