Hi All,
When I use the Screen and the Simulated Strategies, I was confused. What’s the difference between them?
How can I create a Simulated Strategies with the same buy rules achieving the same Annualized Return as the Screen?
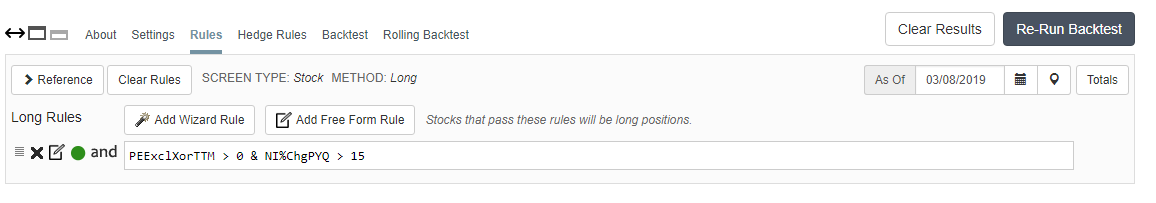
Please check out the attachment for more details.
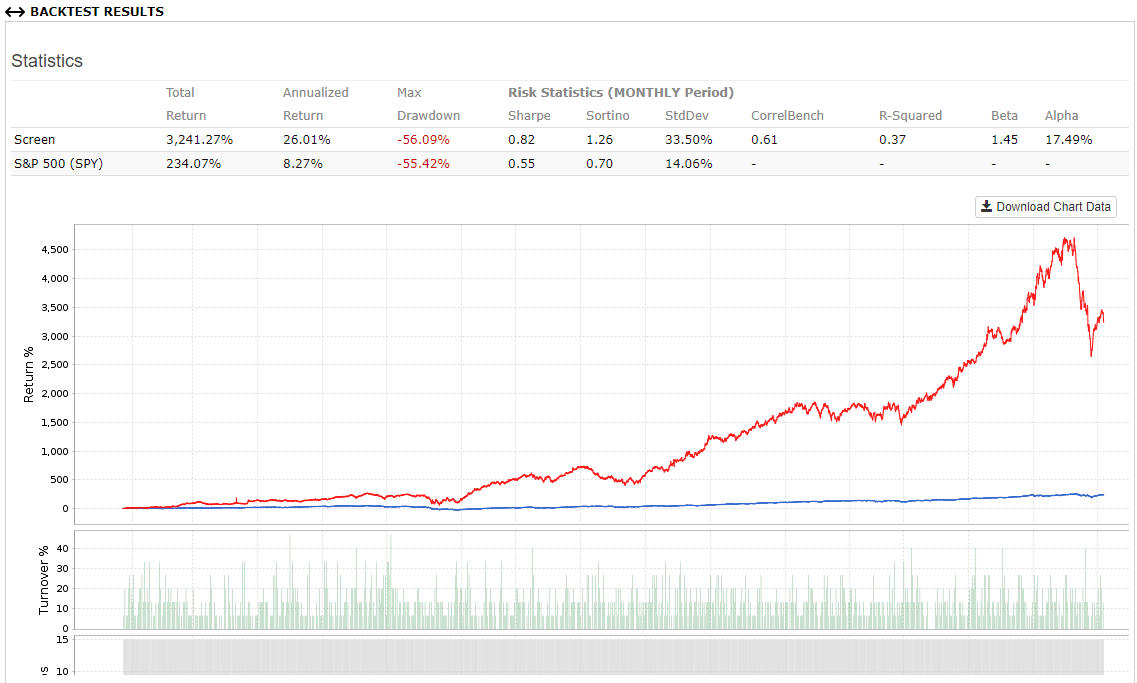
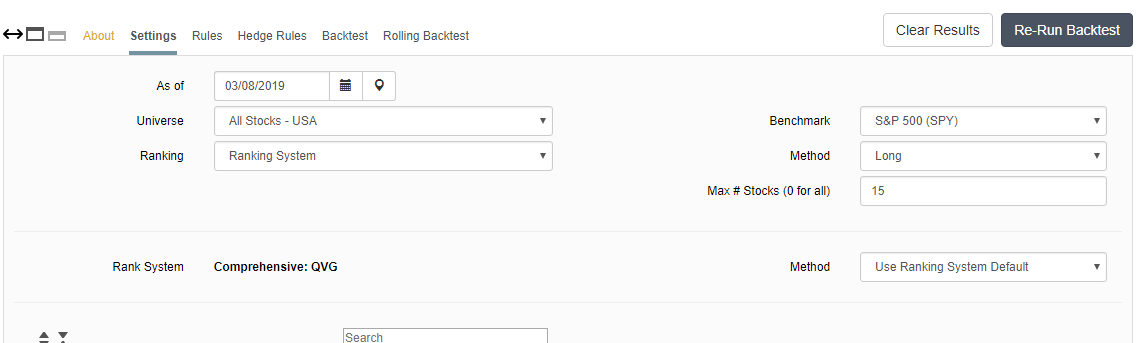
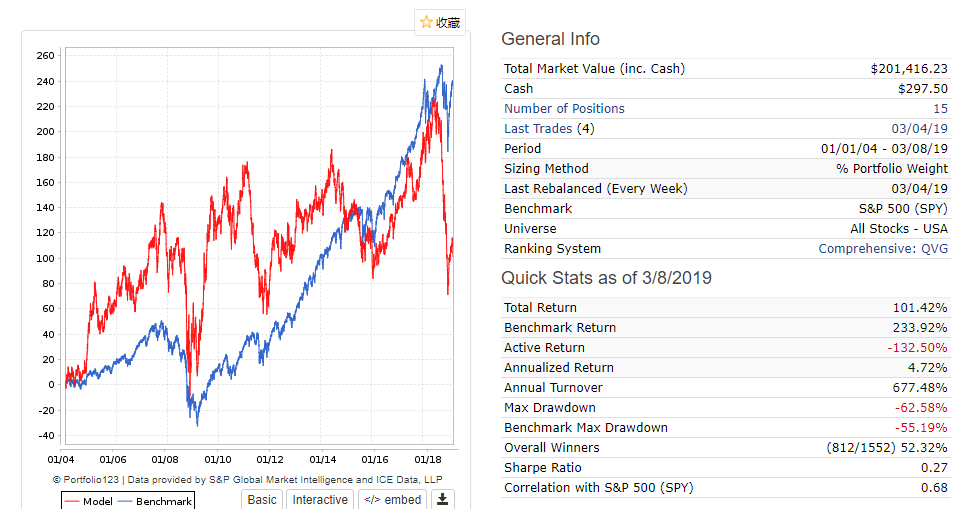
(It seems that the Screen take the tap 15 stocks and the Simulated Strategies don’t. I tried a lot but cannot achieve the same high Annualized Return as the Screen. Need help indeed.)
The simulation and the screener are different animals. The screen is taking an equally weighted basket of stocks that pass the filter and finds the difference in value at the start and end of the rebalance period. It then takes that ending value and it becomes the starting value of the next period. The simulation is doing what you’d probably expect a test to do: It buys the stocks in whole shares and then holds them until sold. It permits you to have a distinct buy and sell discipline, and it takes into account transaction costs as well.
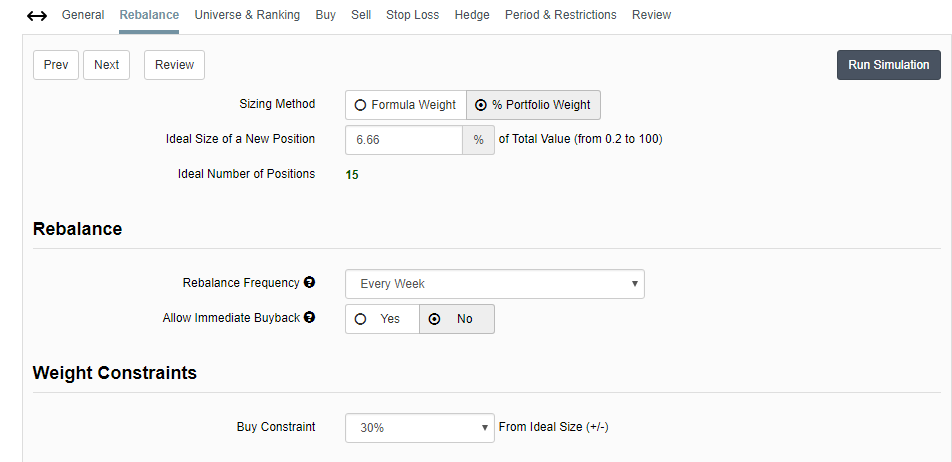
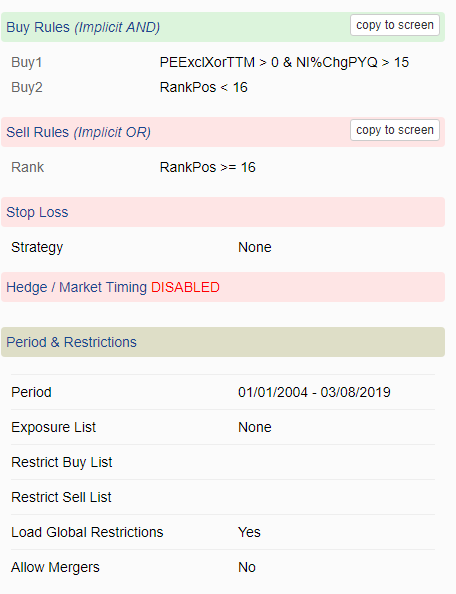
I can tell you, though, that there are two settings in your screenshots that should be changed to get closer. First, Allow Mergers on the Restrictions tab should be set to Yes. When this is set to No, then those stocks that we identify as in a merger situation are either sold at the next rebalance or are rejected for purchase. This is generally a good thing – an acquisition offer alters the relationship between a stock and its fundamentals and technicals. But the screen does not impose this without a special rule, so that needs to change.
But much more importantly, change Allow Immediate Buyback on the Rebalance tab to Yes. The simulation has separate buy and sell rules. This determines what happens if the same stock passes both rulesets. If this is set to No then the sell rules take precedence. If it set to Yes then it will sell the affected stock and then repurchase it. This will, in effect, bring the position back to its target allocation, and you’ll see a transaction labeled Buy/Sell Difference in the transaction list. This latter case, setting it to Yes, is the behavior of the screener.
Try changing those settings in the portfolio (and change the transaction costs to zero) and the two tests should match much more closely. In my experience, you’ll almost never get it to be exactly the same for a number of reasons, chief among them that the simulator is in whole shares and the screener is in partial shares.
Strategies and screens process stocks somewhat differently. I can suggest a few changes to your strategy to make it behave more like your screen, but immediately afterward I will recommend that you discard those modifications!
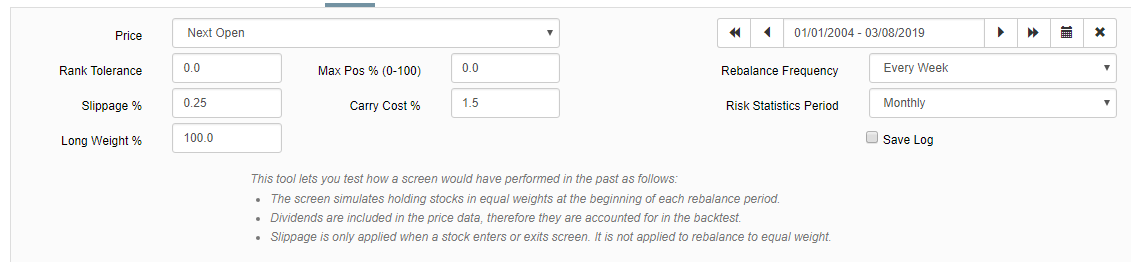
One of the bigger differences between the two systems is how slippage% is calculated. The default for a strategy is ‘variable’ and screen are restricted to ‘fixed’. Variable slippage is more pessimistic for lower dollar-volume stocks. For now, adjust your strategy to use fixed at 0.25% so that it matches the screen setting. Next set ‘Allow Immediate Buyback’ to yes in the strategy Rebalance panel. The sim should look much better.
Now for “bad” news. Those results are probably too optimistic!
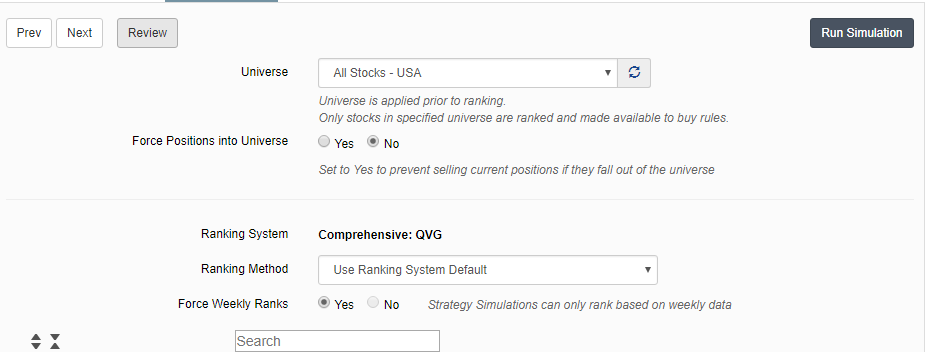
Go back and return the strategy slippage% to ‘Variable’, specify the ‘All Fundamentals’ universe, and at a minimum, add a liquidity constraint to the buy rules. Something like MedianDailyTot(60)>200000 should be OK. You may also want to add market cap and/or price constraints.
@otomii. Were you able to tweak settings so your Screen more closely matched your Simulated Strategy? I have one case similar to yours with a large gap and another case with almost no gap in backtested performance. The large gap is with SP500 universe and the small (negligible) gap is with R2000 universe. Same settings for both other than the universe.