Adding a random factor to a ranking system

Hi all, I was playing around with adding a random number as a factor to a ranking system thinking maybe it can tell me something about the ranking system or process of building a ranking system.

What was tested: Initial model was a 10 factor ranking system with 10 equally weighted factors.
Test cases: An 11th factor represented by “Random”, a random value between 0 and 1. With this factor now the model has 11 factors with 9.09% equal wt each.
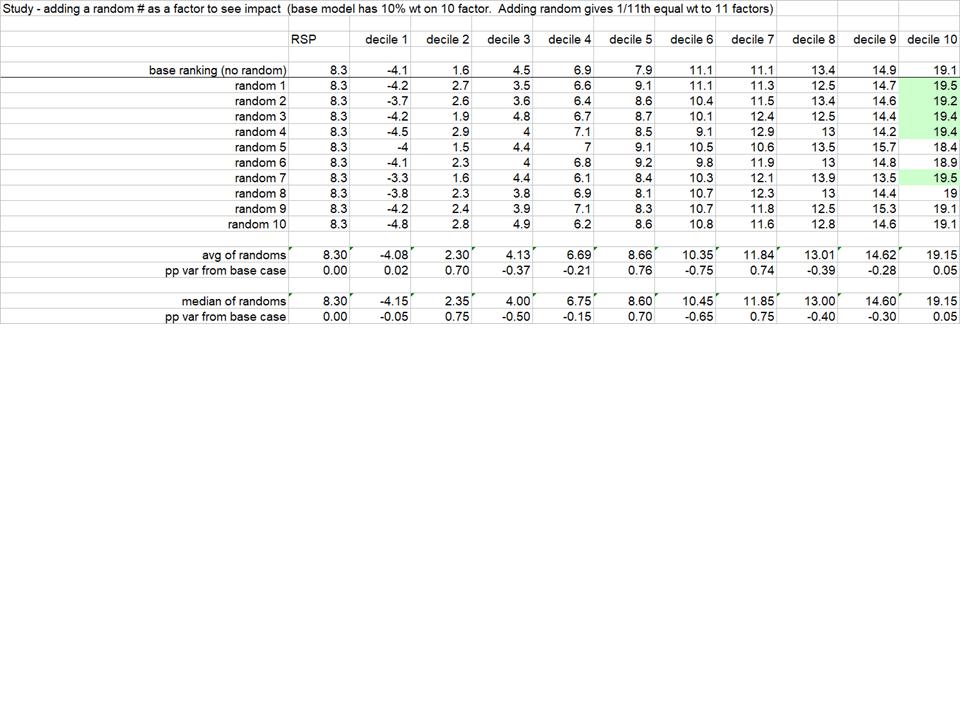
I’ll attach an image with the base model decile performance compared with the 10 runs with the “Random” factor included.

  • The hypothesis going in was that adding a random factor (at 9% weight) should be expected to noticeably degrade the system.
  • While the results support some slight deterioration (the performance of the bottom 50% of deciles gets slightly better and performance of the top 50% of deciles gets slightly worse), the result of 10 tests was far milder than I was expecting.
  • In 5 of the 10 random cases the performance of the top decile improved, and in 2 of 10 it stayed the same. In only 3 of 10 cases did top decile performance deteriorate.

Wonderings on Ranking System construction:

  • Is it surprisingly easy to confuse system improvement from including a factor, with what might be a random result?
  • In many cases in the past I’ve added known individually effective factors to a model that would end up deteriorating overall model performance more than what I’m seeing here. (ex: a factor works well on it’s own, but in the context of a multifactor model it detracts from overall model performance).
  • In 5 of the 10 cases adding a random factor noticeably increased top decile performance 0.1pp to 0.4pp, and makes me wonder how often I might be adding a known effective factor to a ranking system, see performance of the system improve, and conclude the factor was helpful - when it seems completely possible that factor result might just be randomly “working”. (Converse can be true also).
  • Also, in a more meta sense - does the observation that adding a random factor doesn’t seem to make much difference tell me something positive or negative about the ranking system itself (robustness, likelihood of curve-fitting, etc.)?
  • Am I incorrect in the expectation that adding a random factor should be expected to noticeably deteriorate results?

Anyhow, I appreciate any thoughts on this. Wasn’t what I was expecting, but not sure what to conclude from it.


I think the obvious conclusion is that any factor you use should make fundamental sense. If not, you are at the mercy of randomness and just curve-fitting

Hi Michael,

You might also find the topic “regularization” interesting—if you haven’t looked into it already.

-Jim

Why should we expect that adding “random” to a ranking system will produce something other than a bell-curve with a mean at, or close to, the system without random?

We know that your existing ranking system couldn’t possibly have placed all of and only the highest performing stocks in the top decile. Which means that random could push higher performing stocks up into that top decile, just as it could push them out.

I disagree with this. Imagine a system that was 75% random and 25% the other nine factors. The slope of the performance bars would be far lower than a system that was 5% random and 95% the other factors. Randomness should always result in degradation–but it’s a question of to what degree. Here, clearly, not much if any.

I think this is an interesting experiment, and the fact that the random factor does not result in degradation may imply that your ranking system needs improvement. Perhaps a good test of the effectiveness of a ranking system would be that adding a node of randomness weighted equal to the average node weight results in ascertainable degradation of the system.

I also think you should look not just at the top and bottom deciles, but measure the slope of the performance bars. Perhaps your original system performs better than the ones with random added if you take this into account. I’m not saying that slope is an especially meaningful measure–maybe it is, maybe it isn’t. But it’s a tool you can use.

I agree.

I would be inclined to use some of these observations to test for overfitting.

I would divide the rank performance before and after say 2013. I would then optimize before 2013 as best I could and run a rank performance before AND after 2013. Noting both results.

I would then add any factor that I think might be good or MIGHT BE RANDOM and optimize again—e.g., a momentum factor. If you cannot optimize and improve your performance before 2013 then it is just a bad factor (random or just plain bad). Forget about it—for this ranking system anyway.

But if it improves the performance before 2013 then see what it does after 2013. If the performance falls after 2013 (while improving before 2013) then that is pretty close to the definition of overfitting. It is a random factor. You were able to (over)fit the factor before 2013 but is was just that: overfitting. Or fitting the noise.

Psychologically, it is difficult to develop an entire model and then run the final version on a holdout test set. Even if you a wired to be able to do that: “Can I make any changes at all now that I ran the test set? Am I stuck with this port for life?” This does not allow you to sort out the usefulness of each individual factor either.

Maybe we could do this one factor at a time. Even and odd universes can be used for this too.

The truly compulsive would have you do this for the even and odd universes before 2013 to select the factors and then—after you are done–run the test after 2013 using the optimized ranking system to see what kind of performance you might get going forward: as a true holdout set.

P123 has a lot of data. Probably enough to do everything in the last paragraph but it may be debatable. This does eat the data and you always want more when you do any of this.

This is not perfect but if a factor works in the even universe, then it works in the odd universe and then it works in the test set, then it works out-of-sample before putting any money in it: That is a good sign.

If overfitting is not a problem at P123 (and it truly may not be) then you should ignore the above.

-Jim

Thanks all for thoughts,

Hi Yuval, In the average of the trials, the top 50% deteriorated slightly (about -0.2pp), and conversely bottom 50% improved slighly (by that same +0.2pp), so slight chg in slope on grand scale. Do you suggest a suite of slopes at various points on the histogram? like 50 to 100, 50 to 90, 50 to 80… 0 to 50, 10 to 50, 20 to 50, … 30 to 70, 20 to 80, 10 to 90,… etc? Up to now I’ve tended to look at spreads between top 20 vs. bottom 20, top 30 vs. bottom 30, or top 40 vs. bottom 40, etc when evaluating - but I think maybe you’re suggesting something different?

I’m still thinking about what the lack of noticeable degradation is signaling. Will have to test a few more things. Don’t know if it’s a good sign, or a sign, like you mention, of possibility for further improvement by a hidden unused factor.

Jim, Thanks for the thoughts. I’ll probably try this with single factors like you suggest to simplify at first to get a feel for the degree of impact. The effects might also be seen more at the extreme end of the distribution (like 98+ pctile) also.

I measure slope using Excel’s slope function, which is basically an OLS regression. Take the ten decile returns as cells A1 through J1. In cells A2 through J2, put the numerals 1 through 10. Then you can get the slope by putting in a blank cell =SLOPE(A1:J1,A2:J2). It’s then pretty easy to compare the slopes of the performance deciles of variations of your ranking system.

  • Yuval

Thanks. That’s quick and useful. In all my years I don’t think I’ve ever used that function. fwiw, the base model had a higher slope than any of the random scenarios. I appreciate the thought on that. I’ll utilize it going forward.

Yuval, Michael, SUpirate1081 and all statistic/machine learners,

I have been playing with another metric that is like an “OLS regression.”

Yuval, you also have done a lot with machine learning recently it seems (eg, K-means). Perhaps, you have done some cross-validation with R or Python. This may be more related to cross-validation that OLS regression, but they are both based on the same principles. Anyway:

If you optimize the even universe and get a rank performance you can then run the same weights on the odd universe as I outlined above.

As you have said, it may not be good to look at just the last bucket. The slope can be looked at.

In addition, I am toying with the idea of taking the difference of the return for each bucket (for the corresponding buckets in even and odd universes), squaring this difference and taking the mean. This will give you something like the MSE or mean squared error.

Remember, the rank performance test is like a regression using “binning” (binning instead of buckets for the machine learners). It is actually an advanced technique that could be leveraged. You can see, looked at this way, it does resemble an OLS.

This can also be done with a metric that you use often the MAE or mean absolute error.

The goal with cross validation is to minimize the MSE or MAE.

This is not exactly what is usually done with cross-validation but it is EXTREMELY CLOSE. It is just as useful for measuring the variance in the ranking systems for the 2 universes (samples in machine learning parlance)—if the even universe is optimized.

It does seem that the systems with the smallest MSE (and this goes for MAE) are the systems with the best returns. And if it truly predicts how well a system will generalized: THAT IS BIG. It only makes sense that the system with the least error in prediction could find the best stocks.

P123 is an awesome system. It has the even/odd universes for cross-validation and it could be leveraged to develop a complete system for cross-validation. If the community found some benefit from a cross-validation system: THAT WOULD BE REALLY BIG. And this is easy to do. So easy that it, too, can be done on a spreadsheet and one would not have to wait and see what P123 thinks about the idea.

But if it could help even a few designers build systems that generalized well…….And P123 become a complete quant site with a fully functional cross-validation system. Good for advertising if nothing else.

-Jim

I think this is pretty problematic. The higher the returns on a backtest, the higher the MSE would be. And the universes have very different performances overall. Let’s say universe 1, with no ranking system, performs better than universe 2. Then let’s say you have three ranking systems. One is optimized for universe 1 and gets a CAGR of 30% on the top decile and only 20% on universe 2. The other is optimized for universe 2 and gets a CAGR of 25% on universe 2 and a CAGR of 25% on universe 1. A third is thrown together hastily and totally unoptimized and gets a CAGR of about 9% on both universes. Which will have the lowest MSE? The thrown-together-hastily one, no? Certainly not ranking system #1. The ideal ranking system for the whole would be the average of the first two ranking systems; you wouldn’t really want to use the third at all.

Yuval,

Thank you for your comments.

Judging from those comments—I did a poor job of explaining my idea. Alas, I made an effort.

There can be no doubt of the universal acceptance of cross-validation as a useful technique for feature selection and to aid in developing systems that actually work out-of-sample. While still open to any (all) comments, I do not think it is worthwhile debating whether my idea succeeds at providing a method of cross-validation (or not). Not while it is not really my idea being discussed.

Good luck everyone on their trading!!!

-Jim

For now, one deep philosophical question will remain unanswered at P123: Could you possibly get more random than Price2Sales with a random number generator? I think we will never know for sure. Maybe it is enough to know that it is pretty random with this universe (S&P500).

Me, I would kind of like to have a tool telling me if a factor is random. And if not random, how much the factor reduces the randomness in a ranking system. Or a more advance question would be whether Price2Sales (a random appearing factor) might add to a system through interaction even though it looks pretty random by itself.

This belongs in this thread because it was about randomness and I think there are some productive ways to look for it, understand it and control it. With regularization it can even be used in a positive way.

In the context of what Michael was doing it is hard to believe that his last factor was the first that was random. We can probably be sure about his last factor but it would be nice to have ways of looking at the first 10 factors too (you didn’t use Price2Sales did you?).

-Jim


It’s interesting that the Rank Optimizer posts much more summary information about rank performance than the Performance tab does.

With the optimizer you get;
MinBucket
MedianBucket
MeanBucket
MaxBucket
First
Last
Delta
Slope
StandardDev

It seems that P123 could easily update the Performance tab to include this information.

Walter

I’ve been thinking about this recently.

To evaluate the effectiveness of a new Buy rule, I’ve started to use it in simulations with only Random as a ranking factor. Setting slippage to 0% (since the top-ranked stocks change very often) and repeatedly running a 100 stock sim, I think I can get some sense when a buy rule provides value. Time will tell.

But I don’t think this will work for ranking systems since factor interaction probably exists. So maybe repeatedly evaluating a ranker against a randomly chosen universe would work. I think Yuval was proposing something like this a while back.

Walter

Good posts,

Not perfect because it assumes linearity, but in addition to what you listed in the rank optimization, R^2 would definitely say something. Adjusted R^2 , which is calculated by Excel, could help in feature selection all by itself, at least in theory. Rank is technically a single number but how many factors are used in the ranking system to get this number could be plugged into the Adjusted-R^2 calculation.

But even more could be done. The rank performance is the same as regression with “binning.” No linearity assumed. Probably, would take one hour of consultation from a major university to get something that would not generate the usual debate about the randomness of the weather—P123 is used at Stanford?

5 minutes to get something definite (probably a complete solution) about a simple adjusted R^2. Maybe with (but possibly without) a linearity assumption at that price. I would go for the full one hour. You would probably get something better than I could even imagine.

Whatever you got they would probably throw in a usable AIC, BIC and Mallow’s Cp method for free.

-Jim