https://actiquant.com/2019/01/08/value-investing-always-works-even-when-the-value-factor-falters/
I always enjoy your perspectives, Marc. One aspect of your analysis of the top minus bottom quintiles of ranking styles caught my eye and is in line with your narrative. Without fail, when Value did poorly, both Momentum and Sentiment did well. And when Momentum and/or Sentiment did poorly, Value did well. It certainly would be nice to somewhat effectively identify, on the fly, changes in the market style likely to hold for a period of time. Perhaps others here have accomplished that; I haven’t attempted it (yet)! Then again, the winter weather is just getting started for me and there will be times that I will be looking for something to keep me busy inside!
Separately, the Power Gauge results are strong! And tsk, tsk! I didn’t think that you would ever attempt to forecast for the years 2918 and (LOL, OMG) 20917! You must be a time traveler from the future! Just kidding, of course. Search for those dates in the text!
Awesome! Thank you Marc.
So what could work is having 3 or 4 nodes that represent the different “latent” factors. Marc has already done this for us with the nodes in his ranking systems: e.g. value, quality, growth etc……
But one could also optimize their own nodes. Try a PCA or factor analysis (if they could get the data and are quantitatively inclined), run a Scree Plot or just use the P123 optimizer.
Then wouldn’t we want someone (Marc, Georg etc) to tell us (weekly) how much weight to put on each node in a ranking system that has these nodes in it? But there is the problem that P123 probably wants to stay away from investment advice—other than RoboAdvice.
Can we do this adequately (to everyone’s taste) with automated P123 timing now? If so good.
In the category of additional RoboAdvice one could have a moving average of how each of Marc’s nodes are doing over the last 3, 6 and/or 9 months. Normalized and ready to plug into the ranking system each Monday morning. Some adjustments might be warranted: e.g., a minimum weight that would be assigned to a category that is performing poorly.
Maybe those who are not that into timing would want to weight according to how the nodes (latent factors) have done over 3, 6, or 9 years. Maybe use a combination of short-term and long-term factors. If everything is normalized already then one could just average any/all of the time-periods he or she is interested in. P123 could probably proved the online equivalent of a spreadsheet for those who wanted to weight factors for the different time periods.
Just an idea inspired by your great work. Again, thank you Marc!!!
[color=firebrick]AND A STATISTICAL ARGUMENT COULD BE MADE THAT LITTLE ELSE COULD BE DONE TO MAXIMIZE YOUR INVESTING PROFIT.[/color] Not that I would necessarily buy my own argument here. But if you have optimized each latent factor in the best way possible (whatever method that is) and then weight those optimized latent factors in the best way (again, whatever method that is actually) then what else is there to do? Well, get out completely at the right time I suppose. Like I said, I am not sure I buy my own argument: but it takes you a long way. As always the devil is in the details: mainly, how to determine the weights in this case. In this regard, one would want to at least see how the RoboAdvisor (above) performs for the different periods.
Marc, if you ever start a newsletter with recommended weights for the different nodes in a ranking system, please let me know! I will invest some of my money in your recommendations.
-Jim
Of course I can forecast out that far. Can’t you? If you need help, see the market forecasting tool I use – attached.
![]()
(For those who get freaked out by long-term prediction, I edited the text.)

We saw what happens at tops.
From April through September, the S&P 100 gained over 14%. The rest of the S&P 500 gained less than 6%.
This is the definition of a momentum market, and makes stockpicking very difficult no matter what factor you are trying to exploit (unless you identify what’s going on and focus on mega cap stocks).
We will be limited to robo advice on day one because that is the only way we could register with the SEC with less than $100 mil in AUM. (Small conventional advisers can register at the state level, but then, we’d only be registered in one state and have to do a bunch of other filings in the other 49 states - yuk, phooey!). But as you mention, newsletters can be on the table since there is a specific regulatory newsletter exception to the registration requirement.
But aside from that, the kinds of things you thought about in print are feasible. To get a sense of style performance in an analyzable way, you might want to choose some representative ETFs with which to work. Here’s an example of something I did not long ago: Conservative Investors: Step Up! – Acti-quant
(When the blog area on the new portfolio123 site is ready, I’ll start reprinting my my stuff there.) Bear in mind that ETF price related info can be accessed through the GetSeries parameter.
For example, to compare growth (IWF) and value (IWD):
$SMA50_200_Growth: close(50,0,GetSeries(“IWF”)/close(200,0,GetSeries(“IWF”)
$$SMA50_200_Value: close(50,0,GetSeries(“IWD”)/close(200,0,GetSeries(“IWF”)
$RatioGrowth2Value: $$SMA50_200_Growth/$SMA50_200_Value
Eval($RatioGrowth2Value>X, Y, Z) etc.
(You could also do it on the fly using ShowVar, and if you love to match parenthesis correctly you can skip custom formula and show var and just type it out.)
If you fiddle around with this stuff and get the hang of playing with these relationships, you can do lots of interesting things.
I definitely get your point.
Weekly updates that are right greater than 50% of the time is all that I will every hope to get from P123 (or anywhere for that matter).
Thank you for your post. And more importantly for keeping P123 going: massaging the data from SP 500 and everything else you do!!
-Jim
Here’s a thread from over a decade ago (!) about factor reversal or factor momentum that seems very relevant to me and contains some insightful points:
Factor Reversal
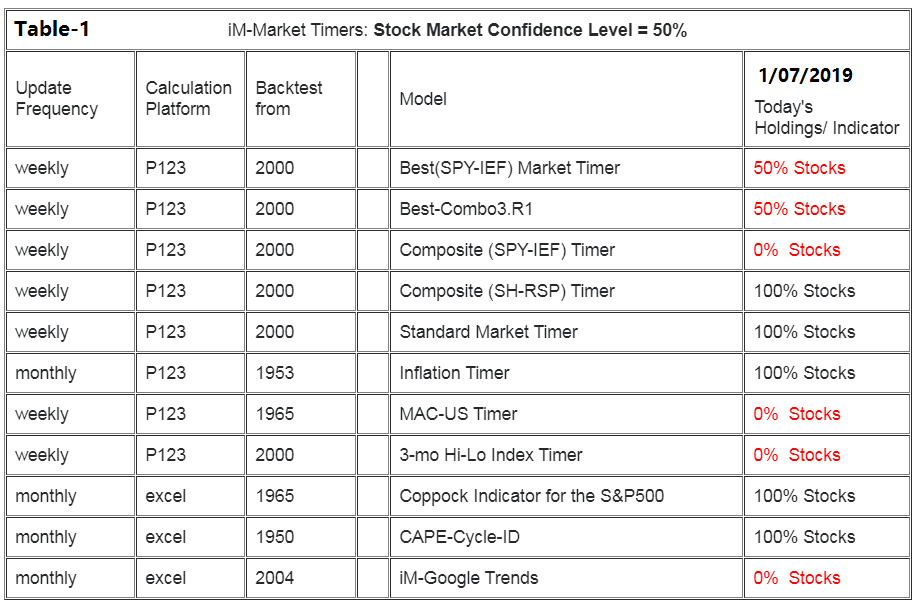
I have been working on a composite market timer that uses 11 of my market timers.
• It makes sense that a composite model of several low correlated timers should be more reliable in delivering signals for profitable stock market investment than a single model could.
• At the beginning of any particular week, each component timer model is weighted 100% when it signals investment in the stock market, or 0% when it is out of stocks.
• A weekly Stock Market Confidence Level (SMC level) is obtained by averaging all the timers’ weights. Thus, the SMC level can range from 0% to 100% during any week.
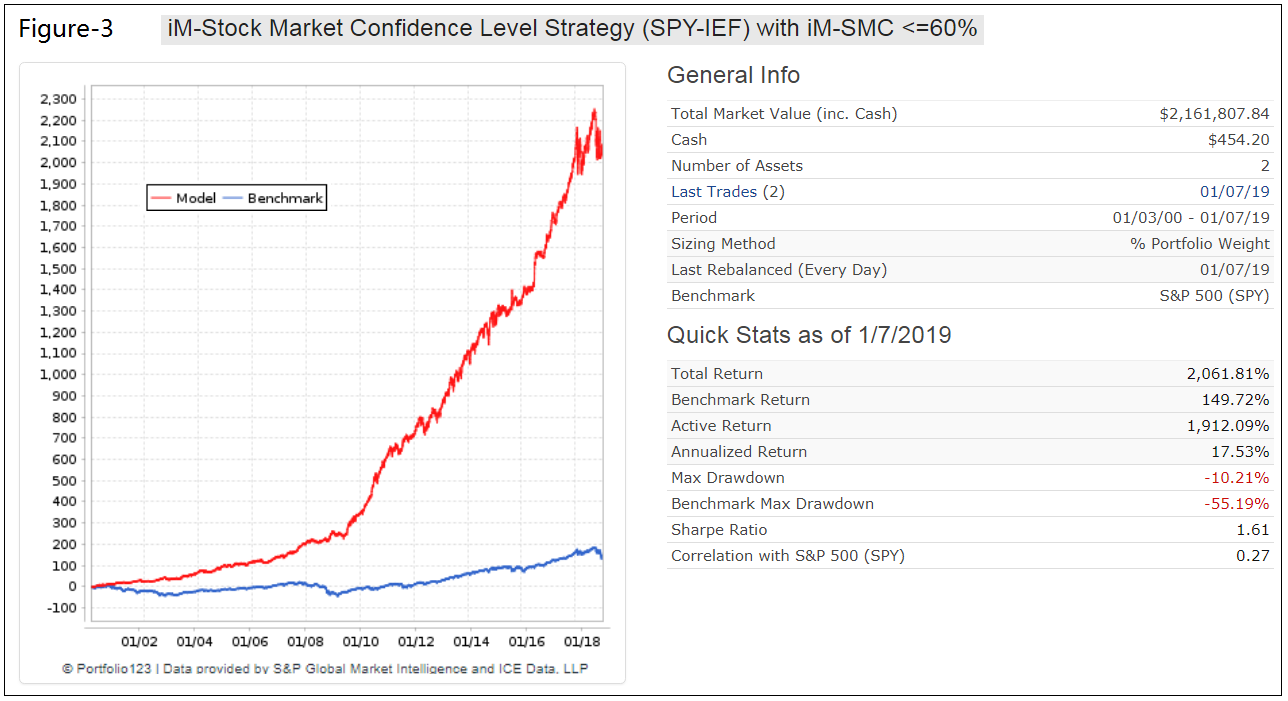
• The optimal SMC level to time stock market investment is obtained by optimizing a stock-bond (SPY-IEF) model for various SMC levels.
Once I have the signal dates I use exposure list for two simulations in P123: SPY-Cash and IEF-Cash, each model leveraged x2.
Then I combine both models in a book, equal weight. Since each model in the book now is weighted 50%, the combo gives performance of an SPY-IEF model.
One can run this with weekly or monthly signals. Weekly gives high annualized return of 17.5% from 2000-2018 with 24 switch trades. With monthly signals the return is 15% with only 10 switch trades over the last 19 years. So I can publish weekly or monthly whether to be in stocks or not.