Hello, I’m new here.
Does anyone know why manual calculation gives another result in this example?
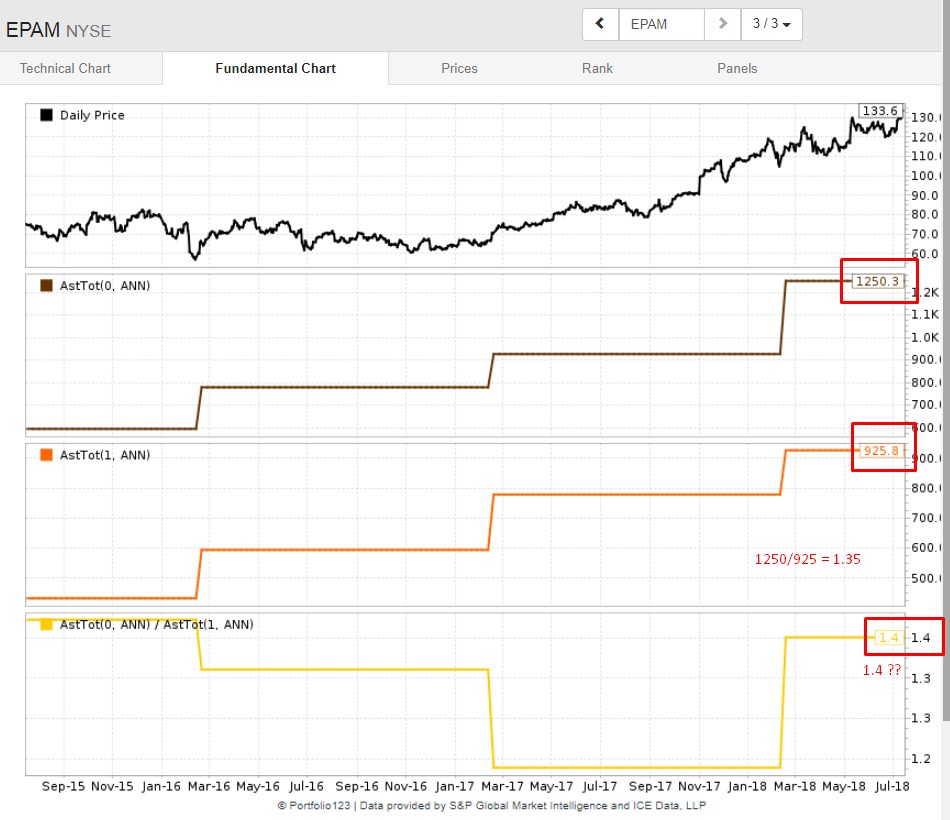
My guess is that P123 is just rounding up.
Try it again using Screener->Showvar and take it out to say 3 or four decimal places.
If the Asset Growth ratio is multiplied by 1000 you’ll get 1350.4, but I don’t know how to increase the decimal precision on the chart though.
- Maybe multiplying by 100 to get 135 for an index centered around 100 would work?
- Or, maybe if the decimal precision is limited to 1 decimal point on the charts, another option would be to change the formula to a growth rate (AstTot(0,ANN)/AstTot(1,ANN)-1)*100
sorry, but I don’t know if the decimal precision in the charts can be changed though.
thanks,
yes, it’s roundind on chart
multiplying by 100 solve the problem
can you give me a link for “Showvar” using example?
thanks, it’s definitely rounding issue
ShowVar is a function in the screener. Use this as a rule:
ShowVar(@test,AstTot(0,ANN)/AstTot(1,ANN))If you then look at the Screen Factors report (on a button just over the list of stocks after you run a screen) then you’ll be able to see the calculated value for each stock.
thank you