multiple regression

Does anyone here use multiple regression to analyze or determine factor weighting? Or has anyone used it in the past?

A Seeking Alpha member told me, “You may want to test your model using a multiple regression model. There are many statistical packages that offer this. This would allow you to still develop optimal weights but it would account for the multicollinearity and could test whether any of your variables really make a statistically significant contribution. This is usually one of the first methods that a predictive modeler would try and books have been written about the methodology.”

It sounds interesting, but I wouldn’t know where to begin, so I was wondering if someone else had tried this.

Yuval,

My $0.02.

I have tried this using ZScore in the ranking system. EG wt1ZScore(Factor 1) + wt2 ZScore(Factor 2)….Wtn*ZScore(Factor n). All one node. And, yes, I have taken a sample of stocks over multiple time periods and run a multivariate regression on the sample to get the weights. This, I believe, is a true multivariate regression method. But I do not think the statistical values were valid when I did it.

As far as a stock picking method: THE ABOVE METHOD WORKS VERY WELL!!! Almost as good—for me—as using the default (usual) P123 ranking method. If anyone can make this work better than the default P123 ranking method then GREAT!!!

Personally, I have accepted that P123’s ranking method (or the ZScore method) is NOT a valid statistical method. Rather it is a MACHINE LEARNING METHOD with some similarities to statistics. I do not think a simple multivariate regression yields usable statistics with valid assumptions for my purposes. Starting with the fact that little of what we do is linear. But there are multiple assumptions that are difficult to satisfy with multivariate regressions.

I still like statistics to see if my machine learning method has me on the right track. The best method for this (for me) is to use Bayesian Statistics with the appropriate prior. And simply compare my results to the benchmark: similar to a t-test.

The Bayesian statistical method is simple (with a little practice), valid, robust and resolves the multiple comparison problem for any statistical questions. But that is just how I do the statistics now and my experience using these two machine learning methods.

Machine learning is about finding the right stocks (or right movies for Netflix, or this right credit card customers for banks). One should not be a stickler about the statistical assumptions.

Multivariate regression is a core machine learning method and if it works use it!

If you are going to get into evaluation for multicollinearity you probably have to go with something like SPSS but it is not cheap. I have used some trial versions including one that did bootstrapping for linear regressions. My daughter had access to this as a college student (without the bootstrapping). Of course, I only looked at hers and never had a chance to download it on my computer (if she did this while I wasn’t looking I am not aware). I do not think this is cost effective for me now. Excel does basic multivariate regressions and JASP is free. JASP is working to mimic SPSS and provide Bayesian statistics too: I am not sure that it is has caught up to SPSS for linear regressions yet.

Ultimately, R has all the funtionality that SPSS has (and probably more) with a bit of a learning curve. But you can often copy script from the web and many package require only a little script to be fully functional.

-Jim

Yuval,

I have tried using regression for determining the weights, and it did not work well at all. The problem is that a plain vanilla multiple regression will overfit the weights to the sample data, and it will fail out of sample. Especially if you have factors that are very similar (highly correlated) then a regression will give you completely bogus weights.

There are techniques like ridge regression and lasso which you can combine with cross validation to help avoid overfitting (and the multicollinearity problem). But I never had much success with those. Once you get the overfitting to an acceptable level, the performance does not exceed simple equal weighting.

I have tried several other techniques, and I haven’t found anything yet that consistently outperforms equal weights. There is so much noise in stock returns that optimization algorithms have a very hard time picking up the tiny signal that is in there.

Regards,
Peter

Yuval,

A couple screenshots to suggest that this is not a crazy idea.

This is old. So I cannot say for sure how I arrived at these weights in front of the custom formula ZScores. I can say that I one point I put a lot of time into doing screens with ShowVar(“Zscore(function 1)”) and next week’s return.

I downloaded the data into a spreadsheet and ran a true multivariate regression on the array. These weights might have been optimized after I did this however.

I show 5 buckets in the rank performance for this function to begin to suggest that it did work but I am not trying to sell anyone one my ranking systems or go into any detail on this. As I said above, just optimizing with the usual P123 method worked a little better but both were good.

Again, I do not think this is a bad idea. And if you pursue this there would clearly be areas of improvement going ahead (over the way I did it).

One could start improving on what I did by:

  1. getting access to data in a better way that I did (ShowVar)

  2. Paying more attention to the ZScore trim, Winsorizing etc

  3. Using better factors…….

  4. I addressed possible multicollinearity in primitive way. Starting with using a few factors that I did not expect to be highly correlated. There are probably betters ways than the way I did it.

  5. etc

Hope this helps in some way.

-Jim


It is generally syngerstic to do a PCA for variable selection in conjunction with a multivariate regression.

PCAs are useful to minimize the number of dependent variables in order to mitigate problems associated with endogeneity and multi-colinnearity.

David,

Good stuff. I have spent that last few hours learning a little more about PCA.

I like this stuff but I decided a while ago that until I add ClariFI as a service–which has the option of using Ranks or ZScores–I mostly need to focus on Ranks. And Ranks may ultimately be the best anyway (as a non-parametric method).

So the question is: Does a ranking system have a similar problem with multicollinearity and what are the remedies?

I wonder if putting similar factors into a node does something a little like using PCA. Value factors in one node, momentum factors in another, quality factors in another……

I think when you put the highly correlated factor into a node it is like combining factors together which is an often stated remedy in any textbook I have read on this this subject.

And remember, grouping factors into nodes is not like putting parentheses around a bunch of numbers being added together. Where you put the parenthesis (or what is grouped into a node) matters: the results do not have the associative property.

Okay, going a step further and saying it is like PCA may be a bit of a stretch….or is it? The nodes are not made to be perfectly orthogonal using mathematical techniques but you have defined a value vector (node), a momentum vector and quality vector which will not be perfectly orthogonal but these nodes will be more orthogonal than when you started if you use a large number of separate factors (vectors).

More simply and more outcome oriented: is using nodes a way to mitigate the problem of multicollinearity in ranking systems?

Thinking about it, Marc always groups things in nodes and he generally beats his benchmark. A hidden advantage to his systems—unknown even to him perhaps—leading to his success? Clearly anyone who thinks using too many factors in a system is a bad thing might have to wonder why this does not seem to hurt Marc’s systems. Or more precisely, why his backtest seem predictive of the out-of-sample performance. Something that multicollinearity can mess up.

Hmmmmm……

-Jim

Ridge regression is very similar to doing PCA and then multiple regression (except that it’s all done in a single step). With ridge regression, there is a parameter that you need to choose yourself (or using cross validation). One could interpret this parameter to be similar to choosing the number of variables to select with PCA.

But the root cause of the problems with OLS, ridge regression, and certainly PCA as well, is that all those methods assume the correlations between regressors (factors in this case) to stay constant over time. If the correlations change just slightly, then the optimal weights that will be found can be wildly different. Predictions also assume that future correlations stay the same. If not, then the predictions can also be very wrong. And in the stock market, correlations are never stable…

PCA and ridge regression will deal with highly collinear variables by giving them roughly equal weight. If you have 2 identical variables, they will each get half the weight. If you remove one variable, the remaining one will get all the weight. That’s fine.

In a ranking system, if you include the same node twice and give all nodes equal weights, the duplicated node will have twice the weight.

In plain OLS however, if you include two identical variables, then you will not get a solution. If you have 2 very highly correlated variables, then the weight of one will become very large and positive, and the other will become very large and negative. This is a problem for predictions if you get a situation where the correlation is not perfectly the same as in sample: the prediction will become very large (either positive or negative) and will not make any sense.

Regressions seem to work very well when you only do them in-sample. They will fit perfectly (given the assumption of linearity). But you absolutely need to check the performance out of sample as well. You will quickly see the astounding in-sample performance fall apart out of sample.

Regards,
Peter

Btw, running a regression in R or whatever requires you to have access to the data of course. For every symbol and every week, you’d need to have the return for that week (this is the y variable), and the rank at the start of that week for all the factors you want to include (these are your X variables). P123 does not allow you to download this data however.

One alternative is to use so-called “gradient descent” (or ascent). It’s actually very simple. 1) You start with a certain ranking system. 2) You tweak one or more weights and run again. 3) If it’s better then you keep the weights, otherwise you don’t. 4) Go to step 2 until you’re happy (or fed up).

The analogy is that it’s like a blind man trying to climb a hill. He can only feel directly around him. If he always walks in the direction that he can feel is the highest point next to him, he will always find (a) top of the hill. In OLS and ridge regression you’re lucky, there is only one top to find.

There are smart ways to choose how to tweak the weights in step 2, and how you tweak the weights will determine how many iterations you need to converge on an optimal solution. Quite some time ago Stitts posted an Excel sheet which you could use together with the P123 optimizer feature that allows you to run many slightly different variations of a backtest. The Excel sheet would decide which parameters to try next. But I can’t find that post anymore.

Peter,

Yes!!!

Take-home-point (I think) is there are effective ways of optimizing the P123 ranking system other than OLS regressions. All covered in basic machine learning courses. And for those who say they do not like machine learning then you should probably not use one of their most used tools: regressions.

BTW, if you wear glasses (and see pretty good) you have this “gradient descent” method to thank: “which is better one or two.” Move toward the gradient of improvement. Repeat. This is done in 3 dimensions (the spherical correction value, astigmatic correction value and the axis of the astigmatism), In medical school they do not give much of the math theory behind this: they just tell you to do it. But if you think of all the different combination of lenses you could put in a pair of glasses and the relatively small amount of time it takes to arrive at the correct result (out of all of the possible results) it is a remarkable thing. It would be a mistake to trivialize this method or discount it for other uses such as ranking systems.

Anyway, I probably made a few mistakes above. Peter is the expert. Most of my practical math skills are binary now: “with is better one or two;-)”

Peter: you were a great help to me in the past when I was going through my stage of multivariate regression (as Yuval is now). You helped me understanding it: its potential benefits and limitations. You are largely responsible for my statement above that the statistics are not valid (at least for much of what I do). Peter understands (and may agree) that I mean things like p-values and R-values are good only if the assumptions are good.

I am not claiming to have it right yet but I appreciate being pointed in the right direction.

-Jim

I was assigned a research project along these lines back in my Reuters days, and this experience was the first to push me away from the quant camp. Peter is right. Any such work makes you a prisoner of the specific sample(s) you use and cannot be expected to have any validity at all once you step out of sample. Different approaches to regression can ties you to different aspects of the sample, but still, you’re somewhere in the sample, and the more robust the model, the stronger the lock on those prison bars.

Regression is interpolation. We need extrapolation.

Prominent quants tend to work with bigger sample periods and aim for findings that are valid across a wide variety of different kinds of conditions. That’s fine if you’re an academician looking to discover universal truths. And in this context, the work is probably valid since anything that is likely to happen out of sample will probably resemble something in the big sample period.

But would success at such a project help you invest real money right now. The truths are general and while they may hold up over a 2018-2068 investment horizon, there is no reason to expect them to work in a 2018-2019 or 2018-2020 time frame and for investors, as opposed to academicians, it’s the latter that concerns us.

Another issue is with multicollinearity. In statistics, that’s a bad thing. But for us, it’s often essential for a good model. Statistical best practices presume the data is really saying what we think it says. But in the work we do, that assumption does not hold. Each data set we use is incredibly noisy and multiple representations of the same idea help us by diversifying away the risk of aberrant data in any one item

When it comes to factor weights, for me, my starting point is equal weighting based on the notion that I feel equal confidence in each. (Actually, my starting point is usually equal weighting to a rank category, and then equal weighting to however many factors are under it. So, for example, if I have a Value-Quality ranking system, Value and Quality will each be 50%, but if Value has four equally weighted items and Quality has three, then the individual factors wont all be equally weighted. The Value factors will be .25*.5 and the quality factors will all be .33*.5.) Different weightings emerge from time to time as my equal-confidence conviction varies.

Just my $0.02.

Thanks Marc! Edit: I believe I answered my own question about muticollinearity.

-Jim

Peter,

Thank you for the reference to Ridge and Lasso regressions. I have never performed these, but I have seen them referenced in some of the newer studies on factor modelling. These techniques are definitely on my bucket list of things to learn. Still, I find PCA very convenient for exploratory analyses (e.g, variable selection).

But like you said, the data required to perform these things are not easily acquired through P123.

On a slightly different note, the only place I currently use multi-variate regressions is in DCF implementations in order to estimate the relationships between costs, revenues, and commodity prices. Regressions of two variables have the distinct advantage in that the weights can be found analytically (i.e., without a solver or MC-type engine). The conditions of independence and exogeneity are also more easily satisfied.

//dpa

David,

Thank you again for bringing this back to my attention. This and “factor analysis” is something I have looked at in the past. I plan to spend a good amount of time on this this extended weekend and beyond to find where it can be useful.

For ranks, I wonder if it can be useful at all. I wonder (for ranks) if the best advice so far is not Peter’s (gradient descent). Note there are other optimization methods beside gradient descent such as an evolutionary algorithm. Steve Ager (StockMarketStudent) has even made a simple spreadsheet that uses the evolutionary algorithm that has been helpful to me in the past. Furthermore, it is similar to gradient descent (albeit probably not as efficient) in that it randomly changes all of the weights at once. You then select the weights in the optimizer that gave the best results and repeat. There is Markov Chain Monte Carlo Metropolis Algorithm (the basis for the Gibbs sampler for Bayesian statistics with JAGS standing for just another gibbs sampler being the latest iteration). But it is STAN that uses methods similar to gradient descent that is considered the most efficient (although it has not fully replaced JAGS yet).

I do not see how PCA could be used for ranks as the range (and the variance) for each factor once it is ranked is the same. Whether you are looking at market cap or Pr2Sales the range (ranks) will be 0-100.

Clearly PCA and ridge regression can be used for multivariate regression but there is the problem of getting the data dowloaded: as emphasized by Peter. Maybe this can be used if I ever add ClariFI as a service. But any limitations for ranks may apply to the ZScore of any factor once that factor is standardized.

Furthermore, before factors are ranked one might be able to tell which of these give the most variance but this says little about which is most related to returns. In an “all fundamentals” universe the greatest variance may come from market cap and market cap is (probably) related to returns. But is it more important that Pr2sales with regard to returns?

These apparent limitation are the reason I have not studied these subjects in depth so far. I intend to find where it is useful: it is a commonly use and certainly there are good uses (there has to be). And I intend to clear-up any misconceptions I have at this point.

I apologize if my questions are ill informed at his point but I intend to address this. I am not trying to make any points but rather trying to stimulate further discussion of this interesting—and I think important—topic. The re-examination of PCA, Factor Analysis and Gradient Descent have already been very useful to me.

Oh. And I intend to pull out my “Introduction to Linear Regression Analysis” Douglas G. Montgomery et. al. and not gloss over Ridge Regression and Lasso Regression this time. And review multicollinearity.

Thankful for the discussion.

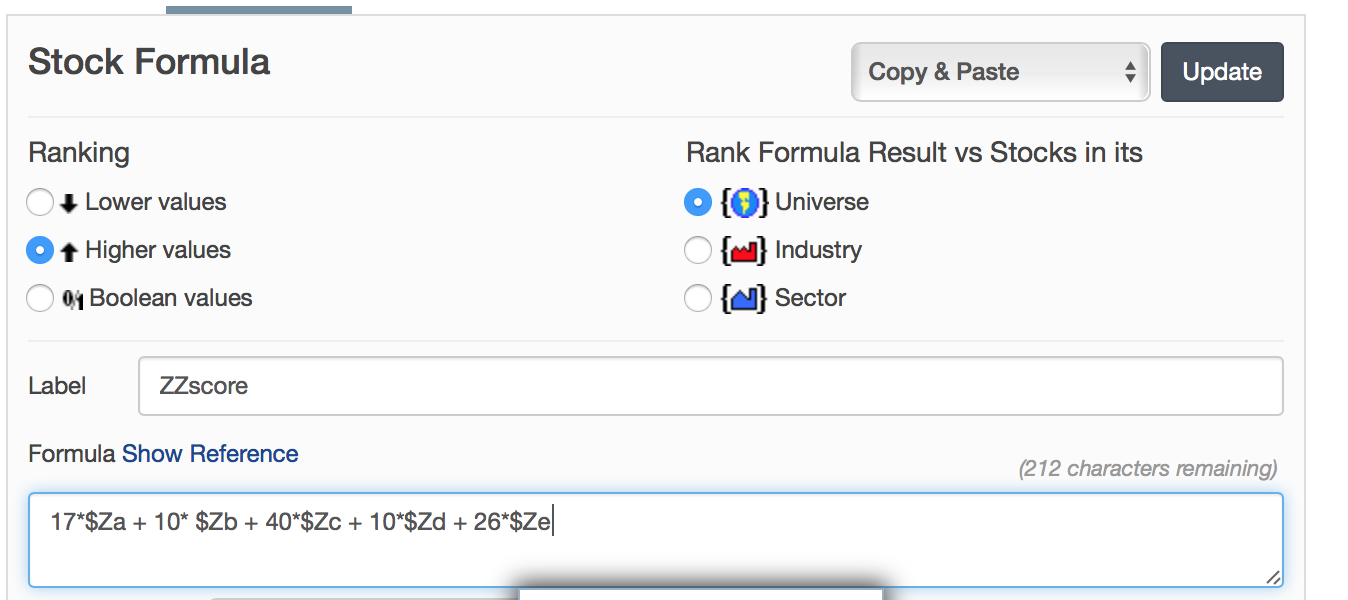
Edit: so if you wanted to use the gradient descent algorithm for ranks you would start with your first factor and increase it a small amount (eg 5%), normalize the weights and run the rank performance test. If the results were made better (by your criteria) then you would repeat. If the results were made worse you would subtract 5% normalize the weights and repeat. When you did this and the results got worse then you would go back to the previous (better performing) weights. You would then do this with the second factor and so on. If you went back through this a few times–starting at the first factor–then you have done a gradient descent. It would easy for anyone using P123 to look into the potential problem of local minima and address this if you wanted to use this seriously.

And with the optimizer (and a spreadsheet to do the normalization) you could run through all of the gradients for one factor (weights 0-100) with one optimization. Select the best performing weights and move to the next factor. You would want to move through each factor several times. You could fine-tune later with 1% increments (gradients). This would address the local minima problem to a large extent.

Probably start the optimizations with equal weights for the factors. Presumably after a few runs things would be moving in the right direction (greater or lesser weights for the individual factors).

You have to love multivariate regression. It is a great machine learning optimization tool: easy and usable before the advent of computers. Now there are other methods worth considering

-Jim

Jim,

I think you are on to something regarding the use of thematic “nodes” to house similar and correlated factors/anomalies in order to mitigate issues with multicollinearity. This in fact seems to be one of the main thrusts behind a lot of the new literature on factor investing. For example, Hou, Xue, and Zhang (2014) house many of known asset pricing anomalies under one of several thematic groups. The authors then determine factor loadings of the models based on the (somewhat arbitrary) groupings. While some of this grouping may be arbitrary or spurious, there appears to be some rigor in variable screening and selection. At the very least, thematic factor groupings are a step in the direction of mitigating some of the systematic biases of multivariate regressions.

//dpa

Sorry to bring this up again, but I’ve been looking into the possibility of conducting discriminant analysis using, for instance, XLSTAT. I know very little about this, but a few things make it look promising. I would think that using quadratic discriminant analysis on ordinal numbers might avoid some or most of the problems of regular multivariable regression. Using ordinal numbers would eliminate the problems of OLS outliers and non-normal distribution, and quadratic functionality would address multicollinearity. The big question, though, is how or if a program like XLSTAT, which I haven’t tried, could interact with the data on P123. If anyone has any thoughts on that issue, I’d greatly appreciate it. There’s a real learning curve for me with XLSTAT, and I don’t want to embark on that journey if it’ll be a fruitless one.

Yuval,

I mainly want to offer my encouragement without claiming to have enough knowledge to make any specific recommendations. Personally, I have developed some renewed interest in the subject.

I will say this: as far as ordinal numbers it has become clear to me that ordinal numbers can be used for the independent variable. When doing this one should be willing accept the ordinal numbers as an “interval variable.” Which, I think, is often the case—or close enough to be useful.

But often ordinal means the dependent variable. This is a different subject that I am not knowledgable enough to have anything worthwhile to contribute on this topic.

For machine learning (picking stocks) trying to fit the in-sample curve has the potential problem of causing overfitting. In fact, is guaranteed to do so if you move to polynomial functions. So, at least in some cases one should use a linear regression whether a line is a perfect fit for the data or not.

In any case, I was doing some of this today. I was reading the linear regression chapters in “Discovering Statistics Using IBM SPSS Statistics” by Andy Field. I was going through some of the examples in JASP. JASP does not do much with nonparametric methods, however.

Of possible use

  1. SPSS uses bootstrapping as one of the solutions for getting confidence intervals when the residuals have a non-normal distribution. This is an accepted method.

  2. Andy Field uses ordinal numbers as independent variables in his texts.

3) It is hard (for me) to get enough data downloaded to run a good regression.

  1. I do not know anything about quadratic discriminant analysis.

  2. All texts will agree that regression can be useful even if all of the assumptions are not met. But the the statistics become unreliable. Bootstrapping and other methods can be used to make statistical statements in some cases where the assumptions are not met.

  3. There are a bunch of tests meant to determine whether one has violated the assumptions or not. So, one needed start with preconceived ideas about what tests may be useful for a particular study.

I wish you the best,

-Jim

Peter,

You are always a great source on this. Stimulated by your post I have used the glmnet package in R—which does Lasso and Ridge Regression.
And I get the advantage of Lasso regression for feature selection.

Even more importantly, I started doing n-fold repeat cross validation. I need to get more hands-on experience with Ridge Regression, however.

So, thank you Peter and everyone else who has posted on this topic!!!

But this brings up what I think is an important question regarding Ridge Regression vs Lasso Regression vs other methods. Are we doing classification or estimation?

The reason I ask is: If we are doing classification then any bias created by the Lasso or Ridge regression causes less of a problem doesn’t it? I think we are using a formula that may be—at least to some extent—estimating the return. But in the final analysis, at P123, we never really calculate the expected return for each stock. We just take the 5, 10…or 25 best stocks. So IT IS A CLASSIFICATION PROBLEM, I think. A little like picking the best credit risks with machine learning and never really calculating the amount you will actually earn after giving these people a loan/credit card.

So call it whichever one you want but any bias created by these methods may have less meaning than one would expect (or even no meaning). It has meaning only to the extent that it affects the relative ranks used for the stock selection. Indeed, with Lasso Regression as a method for selecting weights at P123 the factors would all get normalized and any bias would get normalized away to a large extent.

For those not familiar, Lasso regression and Ridge Regression reduce variance and overfitting at the cost of creating bias. As Peter say they also help with collinearity. Lasso regression tends to remove coefficients in the regression while Ridge Regression never removes them. Instead it only reduces the weights.

So, my impression now is that one might want to use Ridge Regression. This would keep factors that make sense and seem to be significant when collinearity is not a problem. The adjustments in relative weights would not disappear with normalization. Overfitting and collinear problems would still be addressed. Bias remains a secondary issue.

BTW, for those who have posted concerns about outliers in the past rlm (Robust regression) in the Mass package may be worth trying. But I have not had any luck with this and it gives me worse results (on cross validation) than if I leave the outliers in (and do not weight them as rlm does). But that is just me with what I am looking at.

And echoing Peter, a cross validation package: eg, glmnet itself or caret.

If I were to start giving factors equal weight would I do it before or after Lasso regression (or some other method of feature/subset selection)? Guess it depends on how many factors I have started with but no reason to think I have any special insight on this.

Any comments welcome. Thanks.

-Jim