Buy cyclical sectors on the first trading day of the last week in October and sell on the first trading day of the last week in April every year (These are the good 6-month periods for stocks). Buy defensive sectors on the first trading day of the last week in April and sell on the first trading day of the last week in October every year (These are the bad 6-month periods for stocks). This strategy shows significant better returns than buy&hold SPY. The periods’ starting and end dates are listed in the Appendix of the article.
I tested this strategy on Marc’s model Cherrypicking the Blue Chips - Standard because there is no market timing in the model. The annualized return for this model is about 13.4% from end of Apr-1999 to now.
Interestingly, all the performance comes from the good periods in stocks and bad periods in cash. This shows an annualized return of 14.3% from end of Apr-1999 to now. If one inverts the investment approach, good periods in cash and bad periods in stocks, then annualized return would have been -0.9%.
So the odds are poor for good stock market returns over the next 6 month.
BTW the first trading day of the last week in October 1987 was 10/26/1987. That was also the low point of the S&P500 of the October crash which wiped out about 30% from the beginning of the month.
Thanks for your post, thats really a great and easy system! I trade seasonality since 3 years now by simply buying put options on the DAX (mostly cyclical companies) for the 6 months in summer and selling them after a 20% drop. That has backtested to boost annual returns by 3-4% and significantly reduce portfolio drawdowns. From what i know the summer seasonality is strongest in the european markets. But overall your system sounds even better!
Shorting the cyclicals from May to October does not work. Remember you have to pay the dividends and margin carry cost.
From end of April to end of October 5 cyclical ETFs long: annualized return -1.4%
From end of April to end of October 5 cyclical ETFs short: annualized return -1.9%
From end of April to end of October 5 defensive ETFs long: annualized return 1.6%
It is interesting to me that the six month periods from end of October to end of April seem to provide most of the returns from 1999 to now. I checked various DM models which are not market timed and these period always returns more than the periods from end of April to end of October.
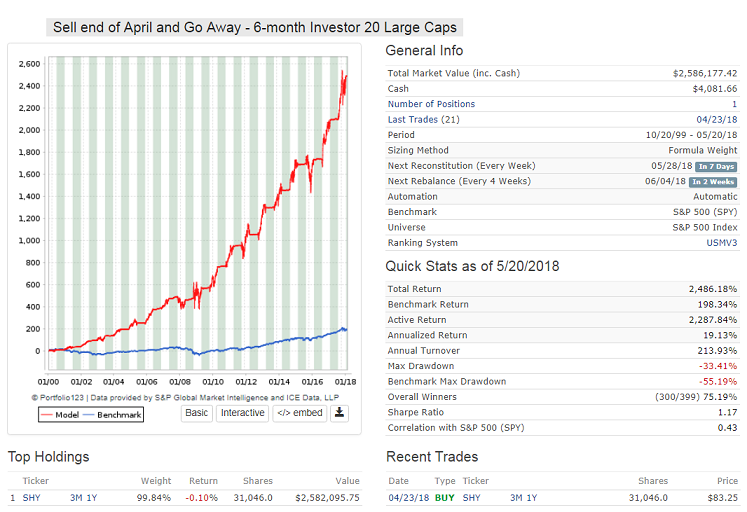
Below is the performance of a model that picks 20 S&P 500 stocks and holds them for six months from end of October to end of April. There is no trading during this period. Then from end of April to end of October it hold SHY. This shows an annualized return of 19%. The return collapses to -1.8% if the strategy is “inverted”.
Going to Cash instead of SHY returns 17.4%. That’s not a bad return for doing nothing.
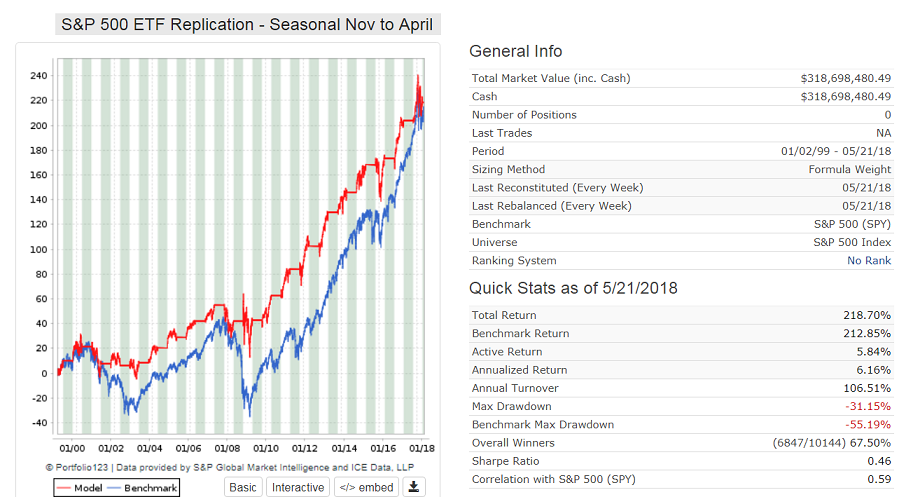
On average, all the returns of the S&P 500 are made during the seasonally six strong months, November to April.
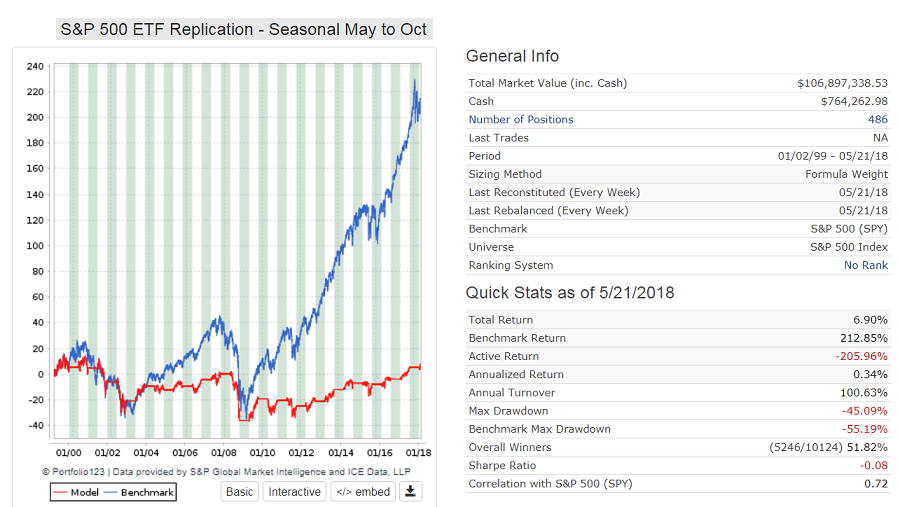
The market shows zero return on average over the seasonally poor months, from May to October. Nobody tells you this, but the odds of winning over the next 5 months are low.
Better have a good trading strategy until October.
Thanks for sharing. Apologies if this is obvious – would you be able to share the rules (syntax) to limit buying in specific months and sell rules for exiting in specific months
Syntax for hedge rules for seasonal investment in SPY from Nov to April:
Go to Cash
enter hedge: (Mod(Month,12)=4 & MonthDay>=23 & MonthDay<=30)
exit hedge: (Mod(Month,12)=10 & MonthDay>=23 & MonthDay<=31)
Syntax for hedge rules for seasonal investment in SPY from May to Oct:
Go to Cash
enter hedge: (Mod(Month,12)=10 & MonthDay>=23 & MonthDay<=31)
exit hedge: (Mod(Month,12)=4 & MonthDay>=23 & MonthDay<=30)
Great info! I modified a micocap simulation to try this idea. In my experiment, the ranker was changed to tilt towards Healthcare, Staple and Util stocks during the May-October (inclusive) months. That’s the only addition. The buy/sell rules remained unchanged. The net effect is to never exclude any sector but to favor defensives buys during the summer/fall months.
Overall, the annualized return went from 33.16% to 35.60%. During the latest three year period, the AR went from 41.53% to 49.94%.
Walter,
That is the correct strategy. Go defensive from May to October.
Designer Models should be checked for performance during the weak and strong periods. Easy to do with the Go to Cash hedge rules, and designers should publish the respective returns. My bet is that there is not a single model that does better during the weak periods if it does not have market timing in it.
I love this (thank you Georg) but I feel some discomfort (read ‘fear of missing out’) using it with live money as I cannot get my head around the following:
What could be a logical decent reason for such a market behavior?
(I can understand August = holiday = lower liquidity = any bad news might have an oversized adverse effect. Although with the massive rise of bots, I am not sure the holiday argument and lack of humans around still holds)
I recon this is relatively well known (e.g. I think Georg - you might have already mentioned something similar years ago on this forum or on your blog). I also remember reading things of this kind on seeking alpha or elsewhere back in 2009 or so.
So, assuming it is “known” at a minimum by the real pros and by many of us the “passionate amateurs”, why does it persist and will it persist in the future?
Jerome,
I don’t know the reason for this abnormality. That could be a PhD thesis for someone. I think that the reason it persists is that it is not in the interest of the financial community to tell people to get out of the market during the bad periods.
And it is not a recent phenomena either. Just tested this for the S&P500 with dividends from 1950 to now; for 68 years.
Buy&Hold 4/24/1950 to 4/23/2018 CAGR= 10.48%
good 6-mo periods: 10/30/1950 to 4/23/2018 CAGR= 8.45%
bad 6-mo periods: 4/24/1950 to 10/23/2017 CAGR= 1.94%
Adding the two period returns gives 10.39%, so this checks ok.
And average for 44 rolling 25-year periods:
good 6-mo periods: CAGR= 8.30%
bad 6-mo periods: CAGR= 1.57%
So our P123 models should be structured accordingly. Worked for Walter, as per his posting.
If I may, I posit some thoughts on why the seasonality of the market appears to be so. I have been aware of the “sell in May and go away” sentiment for many years and have not followed it, perhaps to my loss. I figured it was a well known effect that would be arbitered away.
Many firms perform budgeting and strategic planning relative to annual financial periods, which are mostly reported by May. So they are beginning a new fiscal year with a new budget and strategic plan. That means likely changes throughout the business in employee count, expense adjustments, capital changes, etcetera in the first and second quarter especially. I believe some investors take a conservative step back to wait until the changes pan out, then move money into businesses that they believe will have good annual reports.
Also, most political action (elections and changes in laws affecting commerce) perhaps happen in the November - April period, although I have not confirmed that. Investors are quick to act on anticipated results. Politicians seem quick to try changes they can label as good for business.
This seemed pretty ridiculous until I found out reverse seasonality exists in the Southern Hemisphere (where seasons are reversed). I sometimes wonder what aliens would assess regarding the human condition. Maybe they might conclude that the Seasonal Affective Disorder is just one of those odd quirks about humanity, like chick flicks, cat memes, or skinny jeans. Oh yeah, and the Kardashians.
The “Seasonal Affective Disorder” explanation is ridiculous.
I checked seasonal effects for Australia (^AORD) and Hong Kong (^HSI). Those two markets exhibit the same seasonal effects as the S&P 500. So it has nothing to do with the Hemisphere you are in. It is simple, world markets follow the US market.