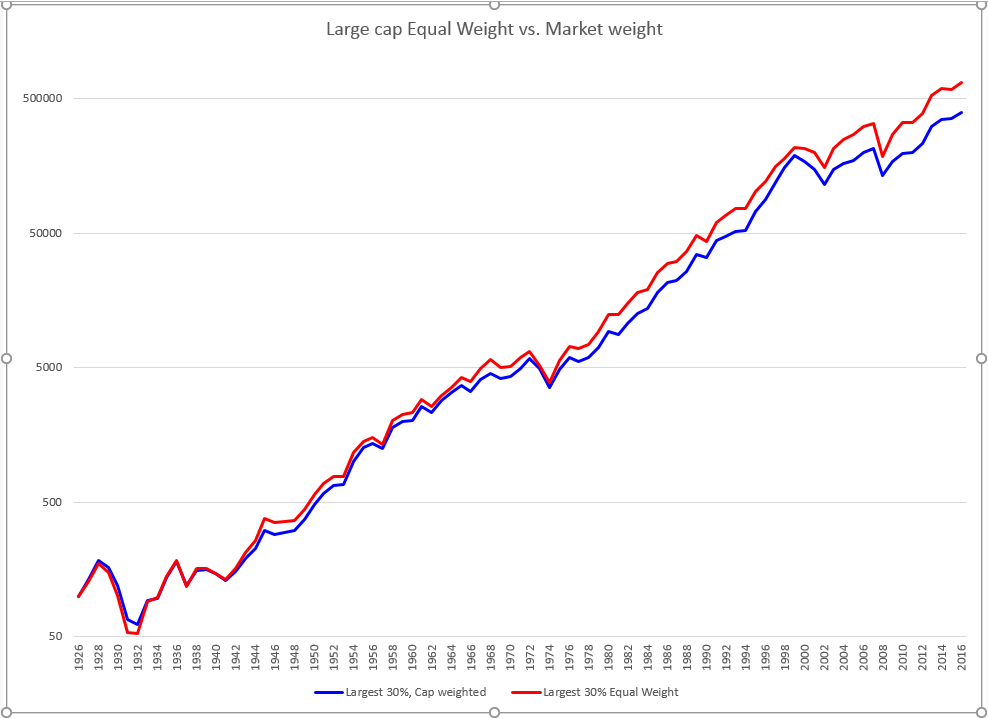
Inspired by another thread, I went back and compared equal weight to cap weight “large caps”.
To simulate “large caps” I used the largest 30% of U.S. stocks. This is not exactly equivalent to the S&P 500 but is close enough for our purposes.
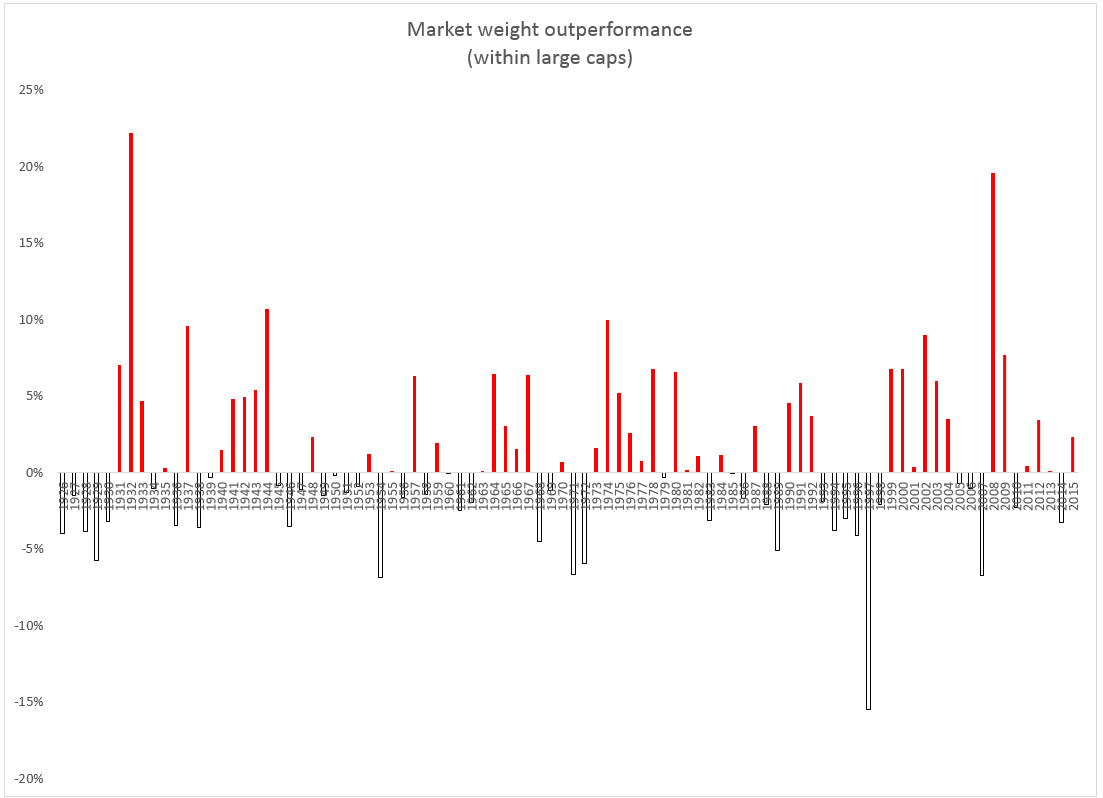
Takeaways:
Equal weight outperformed overall.
During the 66 up years equal weight outperformed 59% of the time.
During the 24 down years equal weight outperformed 33% of the time.
Since 1926, equal weight has only outperformed by about 0.5% a year, but from 2000-2016 it has outperformed by about 3% a year.
In other words, the backtest results that you see here may be overestimating the power of equal weight.
BTW, equal weight is a proxy for small cap.
EDIT:
The bottom line is to expect less going forward from equal weight (or small cap overweight).
These differences look so small that (in my opinion) the added value could be eaten up by management fees, if one compares a low cost market cap weighted index fund to an actively managed equal weighted fund.
Here is the reasoning why, for the S&P500, equal weighting and reverse-cap-weighting will do better than cap-weighting.
An analysis in The Case For Reverse-Cap-Weighted Indexing provides support for weighting the stocks of the S&P 500 Index inversely to their market capitalization in order to achieve higher returns than the index. The rational and method are summarized below:
The 500 stocks of the index are divided into two groups according to market capitalization. Group A holds the top 120, and Group B holds the remaining 380 stocks of the index.
According to the article, once a Monte Carlo simulation to cover all possible permutations of returns for the descending order of weights is run, the expected value of the returns of group A can be expressed as a constant, in this case – “a”.
Likewise, the simulation allows us to express the expected value of the returns of Group B as a constant, in this case - “b”.
Using historical distributions, group A constituted about 67% of the total market cap of all the 500 stocks.
If the stocks of S&P 500 Index were equally weighted, then Group A would only represent 120/500 = 24% of the total market cap of the index.
If the stocks of S&P 500 Index were inversely weighted to their market cap, then Group A would only represent only 4.8% of the total market cap of the index as of Jan-3-2018.
Therefore the expected value of the returns for various portfolios holding all 500 stocks of the index can be expressed in the following equations:
• For the market-cap-weighted portfolio: x = 0.67a + 0.33b
• For the equal-weighted portfolio: y = 0.24a + 0.76b
• For the inverse-market-cap-weighted portfolio: z = 0.05a + 0.95b
Consequently, when “b”, the expected return of the stocks in Group B (the smallest 380 stocks in the S&P 500 by market capitalization) is greater than “a”, then y, the return of the equal-weighted portfolio will be greater than x, the return of the cap-weighted portfolio, and z, the return of the inverse-market-cap-weighted portfolio will be greater than both x and y.
Simulations from 1999 to 2018 confirm that the performance of Group B is much higher than that of Group A, which under-performs the index.
BTW, the stocks in Group B are not small-caps.
The logic is a bit flawed. The market-cap-weighted portfolio requires no rebalancing, except for the 4% or 5% of stocks that enter or leave the index per year. The other two require rebalancing every quarter. For the inverse weighted portfolio, the top-weighted stocks will be sold and another group of top-weighted stocks will be bought, not to mention a huge amount of buying and selling of other constituent stocks (especially the mid-caps). This will not be cheap, and will be more expensive in periods of high volatility. Tracking the index is going to be pretty problematic too.
It would be more practical and easier to establish a market-cap-weighted fund that invests in only the bottom half of the S&P 500. The results, by the logic you’ve adopted, would probably be the same.
Yuval,
It is not my logic and I have not adopted it, I was only summarizing the article.
I agree with you assessment. Also over shorter periods the B group will under perform the A group.
[quote]
So you’re saying the size premium is caput?
[/quote]Future performance may be less than past simulations (especially 21st century simulations). Case in point: Large growth stocks (such as FANG) have led the market both in 2015 and in 2017.
Like most factors, the size premium goes in and out of style. Also, like all factors, it attracts the most attention after having a good run. But when a factor gets too much attention it is not the time to jump on the bandwagon.
On a related note: ETFs do not limit the amount of assets under management. Yet, strategies has capacity constraints. When equal weight ETFs get too big, trading costs go up which detract from outperformance.
RSP, the equal weight S&P 500 ETF, has $15 billion in assets. Each position is $30 million. Huge slippage on rebalance. What happens in a few years when each position will be $60 million?
I think it’s better to think in terms of size as a factor, and not necessarily a premium.
As a factor, size is part of the overall “quality” camp, Large companies are, always were and always will be inherently different from small companies. the only thing that changes is how the market reacts to the differences. Often it has preferred smaller companies, other times, it favors larger firms.
The logic of size as a factor is based on:
Operating leverage - Fixed costs are a larger portion of total for smaller companies, meaning that all else being equal, identical changes in revenue will produce disproportionately larger changes in profit for smaller companies. Changes in profit influence changes in stock price. And this is exacerbated by more volatility in sentiment. That’s why we normally expect higher realized betas for smaller issues.
Operational/customer/client diversification - This, too, influences sales, profit and sentiment volatility much the way the number of issues influences portfolio volatility. (Even supposedly single industry companies can vary a lot in terms of how many different types of customers they serve and with hw many different kinds of goods or services).
Information availability - The less information is bandies about in the market, the easier it si for the stock to be influenced by noise, etc. This, too, influences volatility.
As with any factors, individual oddballs are to be found (and that can spell opportunity for folks like us). But on the whole, large caps are likely to be favored when the market is less inclined to amp up risk, and vice versa,
Equal weighting is a way to tap into the smaller end.
Why would that cause huge slippage? For an existing stock rebalanced from $31M to $30M, that’s a $1M trade. A drop in the bucket!
[/quote]Yes, but index additions require $30M trades.
[quote]
We use VWAP orders on our large trades, and have nearly zero slippage as compared to the daily close.
[/quote]What percentage of daily volume do you trade?
Index additions must present an equal problem for SPY.
SPY Weighted Average Market Cap is currently $204,881-M.
That represents 0.82% of the total MktCap of the index.
If a $10,000-M company is removed from the index it requires State Street Global Advisors to sell $82-M worth of shares of the same stock. So if this is not a problem for them, then RSP can grow a lot more to about Total Assets= $40,000-M.
Slippage is probably 1250% worse for RSP over SPY for stock additions and deletions.
On top of that, rebalancing slippage also costs RSP shareholders. SPY does not rebalance.
The math (edited):
I am estimating that each year roughly 12 S&P 500 constituents switch places with 12 S&P 400 MidCap constituents. That means 12 buys and 12 sells for the least liquid stocks in this index.
Each position in RSP, even the smallest market caps, is 1/500th of the portfolio or 0.2%. That means that RSP trades about 5% of its portfolio each year when they switch places with midcaps.
But SPY is cap weighted. The smallest positions (those that are borderline midcaps) take up as little as 0.016% of the portfolio. That means that SPY trades about 0.4% of its portfolio (0.016% x 24) each year when they switch places with midcaps.
In other words, it costs RSP ~1250% (5% / 0.4% = 1250%) as much as SPY in this type of slippage.
How much does slippage cost for index additions and deletions? Depending on the study, anywhere from 1% to 7% per stock. That means that index changes cost SPY somewhere between 0.004% and 0.028% a year, and costs RSP between 0.05% and 0.35%.
As long as RSP sticks to its methodology, this cost may continue to keep going up.
RSP currently charges 0.2% management fee. That changed on June 29, 2017. Before that date, they charged 0.4% management fee.
Two takeaways. First, mega caps have been outperforming the rank and file S&P stocks recently. Thanks FANG!
Second, the difference between RSP + its management fee and the actual S&P EW TR Index is minimal over time. Implying minimal trading costs + slippage (less than 0.2% per YEAR).