As the subject of the post says, I am trying to replicate the performance of a ranking system in a simulation. For simplicity’s sake, the ranking system is just one facotr, SiRatio:https://www.portfolio123.com/app/ranking-system/320309
The simulation (https://www.portfolio123.com/port_summary.jsp?portid=1510733) has the same setting as the ranking system:
-rebal every 4 weeks
-0 commission and slippage
-performance dates 11/15/12 to 11/15/17
-Universe: SP1500
-75 positions (the ranking system uses 20 buckets, so the top bucket should have 5% of the SP1500 or 75 stocks; the simulation has each position equal to 1.333% of the portfolio or 75 stocks)
-Minimum stock price of $3 and no min liquidity
-Simulation is set to buy at next open
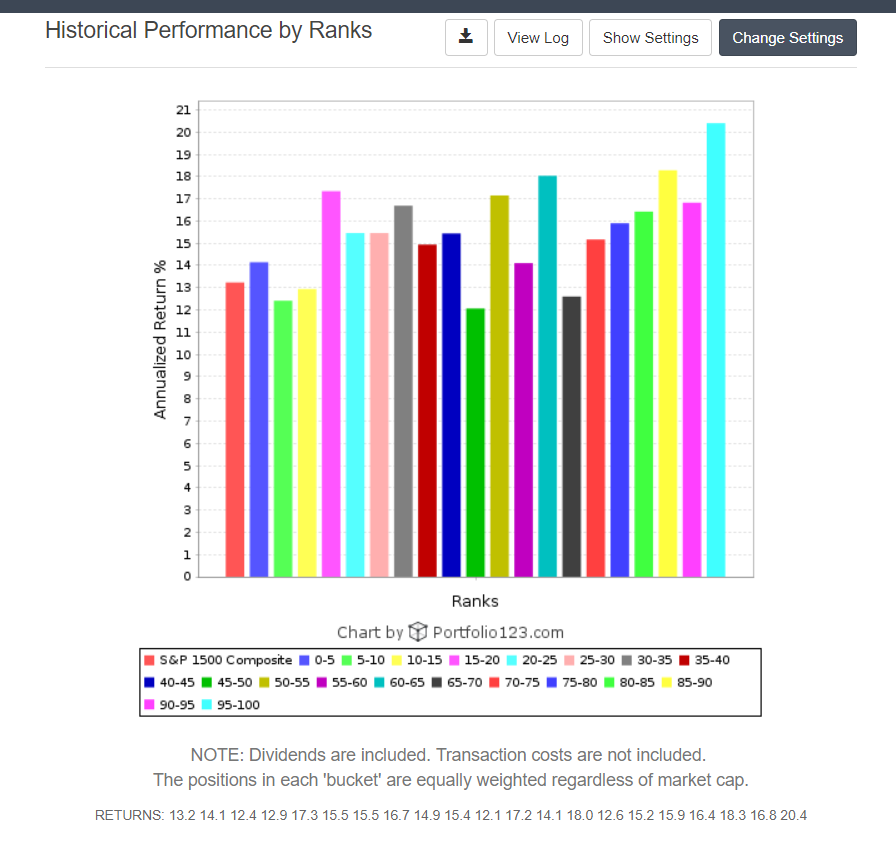
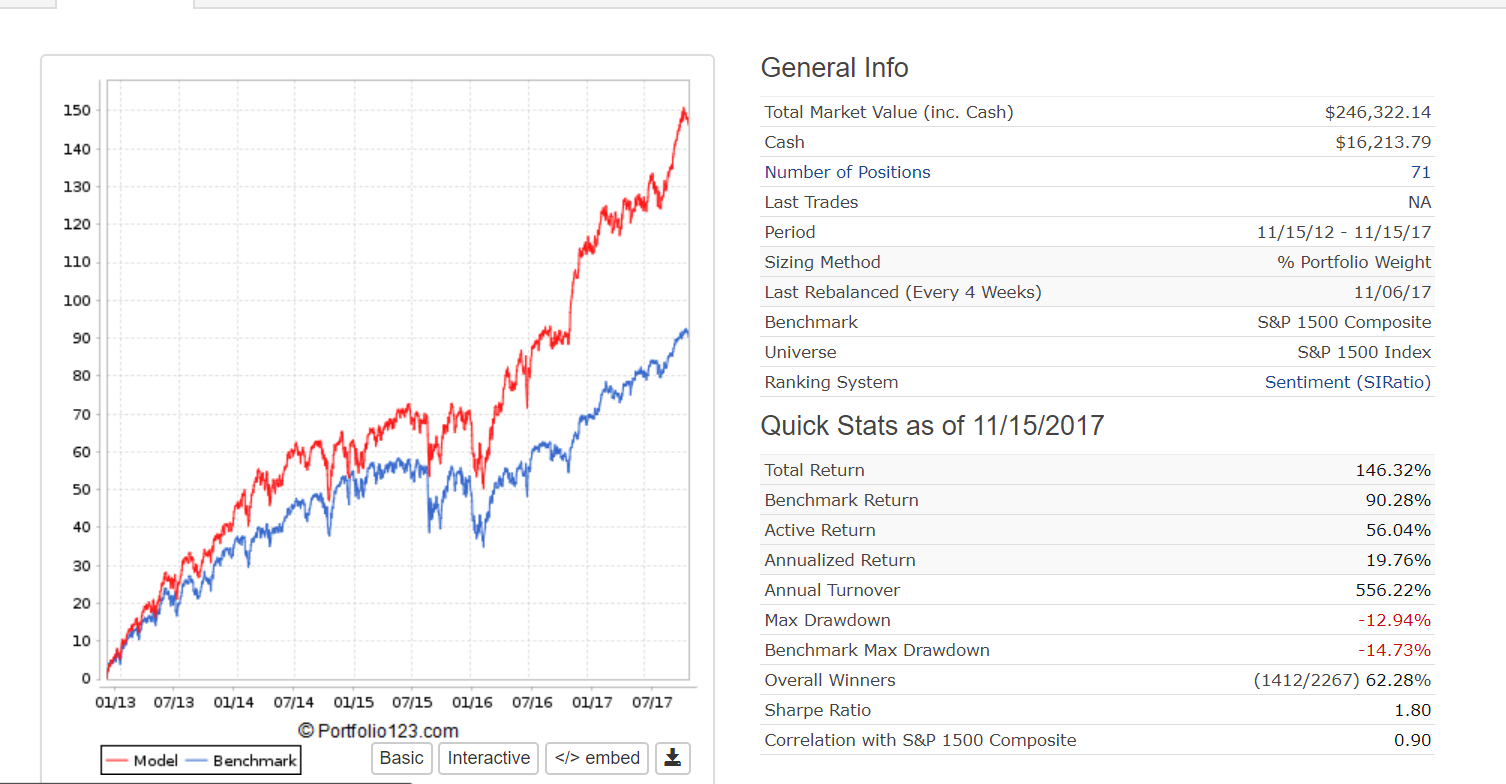
As you can see, the top bucket in the ranking system has 20.4% annualized return while the simulation has only 19.76% returns. You can also see that the simulation doesn’t always have 75 positions. I guess this is due to the buy rule of price > $3.
Questions:
Are ranking systems performances based on buying at next open? (I don’t see it specified anywhere)
How do I fix the above issue, so that the top 75 stocks are bought after the minimum liquidity rules are met? Right now some of the top 75 stocks stocks have stock prices under $3 so I guess this is why the portfolio has less than 75 stocks.
Am I missing anything else in order to exactly replicate the ranking system performance with the sim?
The ranking system performance is going to equally weight a bucket every four weeks.
The portfolio is going to let some positions get bigger or smaller than equal weight over time, as long as the stock continues to have a low SIRatio and is not sold. If you look at your holdings in the port, ESIO is weighted at 2.67%. Your smallest holding is KEM at 0.81%.
This impacts the number of stocks you will hold, as your target weight is 1.33% with a 30% deviation. So if you sold KEM with a current weight of 0.81%, you might not have enough cash to replace it.
You might try setting a sell rule of RankPos > 0. This sells all your positions every 4 weeks. As long as you allow immediate buyback, this should then equally weight 75 holdings every 4 weeks.
However, your 20 ranking system buckets are not going to be 75 stocks each, because you exclude stocks priced below $3. Currently, there are 1493 stocks in the S&P 500 over $3. Back in January 2016, there were 1475.
Finally, you have a liquidity rule in your portfolio re: trading volume that is not considered in the ranking system performance.
Thank you for the reply Miro! So to address the issues you brought up, I deleted the buy rule “rankPos<76” and I changed the sell rule to RankPos>0. This should now rebalance the portfolio every time to exactly 75 stocks at 1.33% (or as close to it as possible) that have a stock price greater than $3 (just like the ranking system test). So now I get 21.1% from the simulation (https://www.portfolio123.com/port_summary.jsp?portid=1510733) compared to 20.4% from the ranking system. Maybe I’m nitpicking, but if we’re going to rely on these systems, I feel like we should know exactly how they work and why two things that should be identical are different. I hope you agree! Any further thoughts from anyone are much appreciated!
One clue would be to click on “View Log” after running the ranking performance and compare it to the transaction records on the simulation. (You have to click on the “save log” button when you run the historical performance by ranks.)
Thank you Yuval and Chipper6. I update the sim to buy on next close. To simplify looking at the ranking logs, I change the ranking test and sim to use to following settings:
Universe: Nasdaq 100
Buckets: 50 (2 stocks per bucket)
Simulation position size: 50%
Backtest Period: 11/19/2012 (Monday) to 12/17/2012 (Monday, one month later)
I downloaded the log file for the ranking system, the simulation transactions, and the simulation performance and put it all in one spreadsheet (see attached). With these settings, both the ranking system and the simulation buy the same two stocks (MRVL and MNST) on 11/19/2012 and sell on 12/17/2012. The simulation uses unadjusted for splits and dividend stock prices while the ranking system uses adjusted prices, but that shouldn’t matter. You’d think you’d get identical numbers but as you see in the yellow highlighted row at the bottom, there are still unexplained differences. Like why the simulation purchase prices have precision beyond the penny (even though they are unadjusted for dividends and splits) and are different than the prices from 11/19/12 from portfolio123’s historical data tab. And why the returns even within the ranking logs aren’t consistent. For example, the log says Marvel was bought for 6.99 and sold for 7.61. If you calculate the return yourself, you’ll get 8.87%, but the log shows an 8.88% return. Then even if you take the individual returns for each stock in the bucket and average them, (8.88% + 16.65%)/2, you get 12.765% which is different than the reported bucket return of 12.7637%.
I realize the differences in the spreadsheet are relatively small, but this is just over the course of one month. When you multiply these differences over the course of a 5 or 10 year sim, I’m getting differences in annual bucket performance vs a sim designed to replicate it of as much as 2% sometimes. That’s pretty big over 5 or 10 years, no? Any thoughts would be much appreciated!
Few other quirks. Ranking performance buys exact $ amounts (fractional shares if you will). Also the price series used in the rank performance are dividend adjusted as of the ex-date. In other words it has the money “upfront”, whereas the sim is more realistic getting the cash on the pay-date. This is because rank performance doesn’t really have “transactions”. It works like the screener.