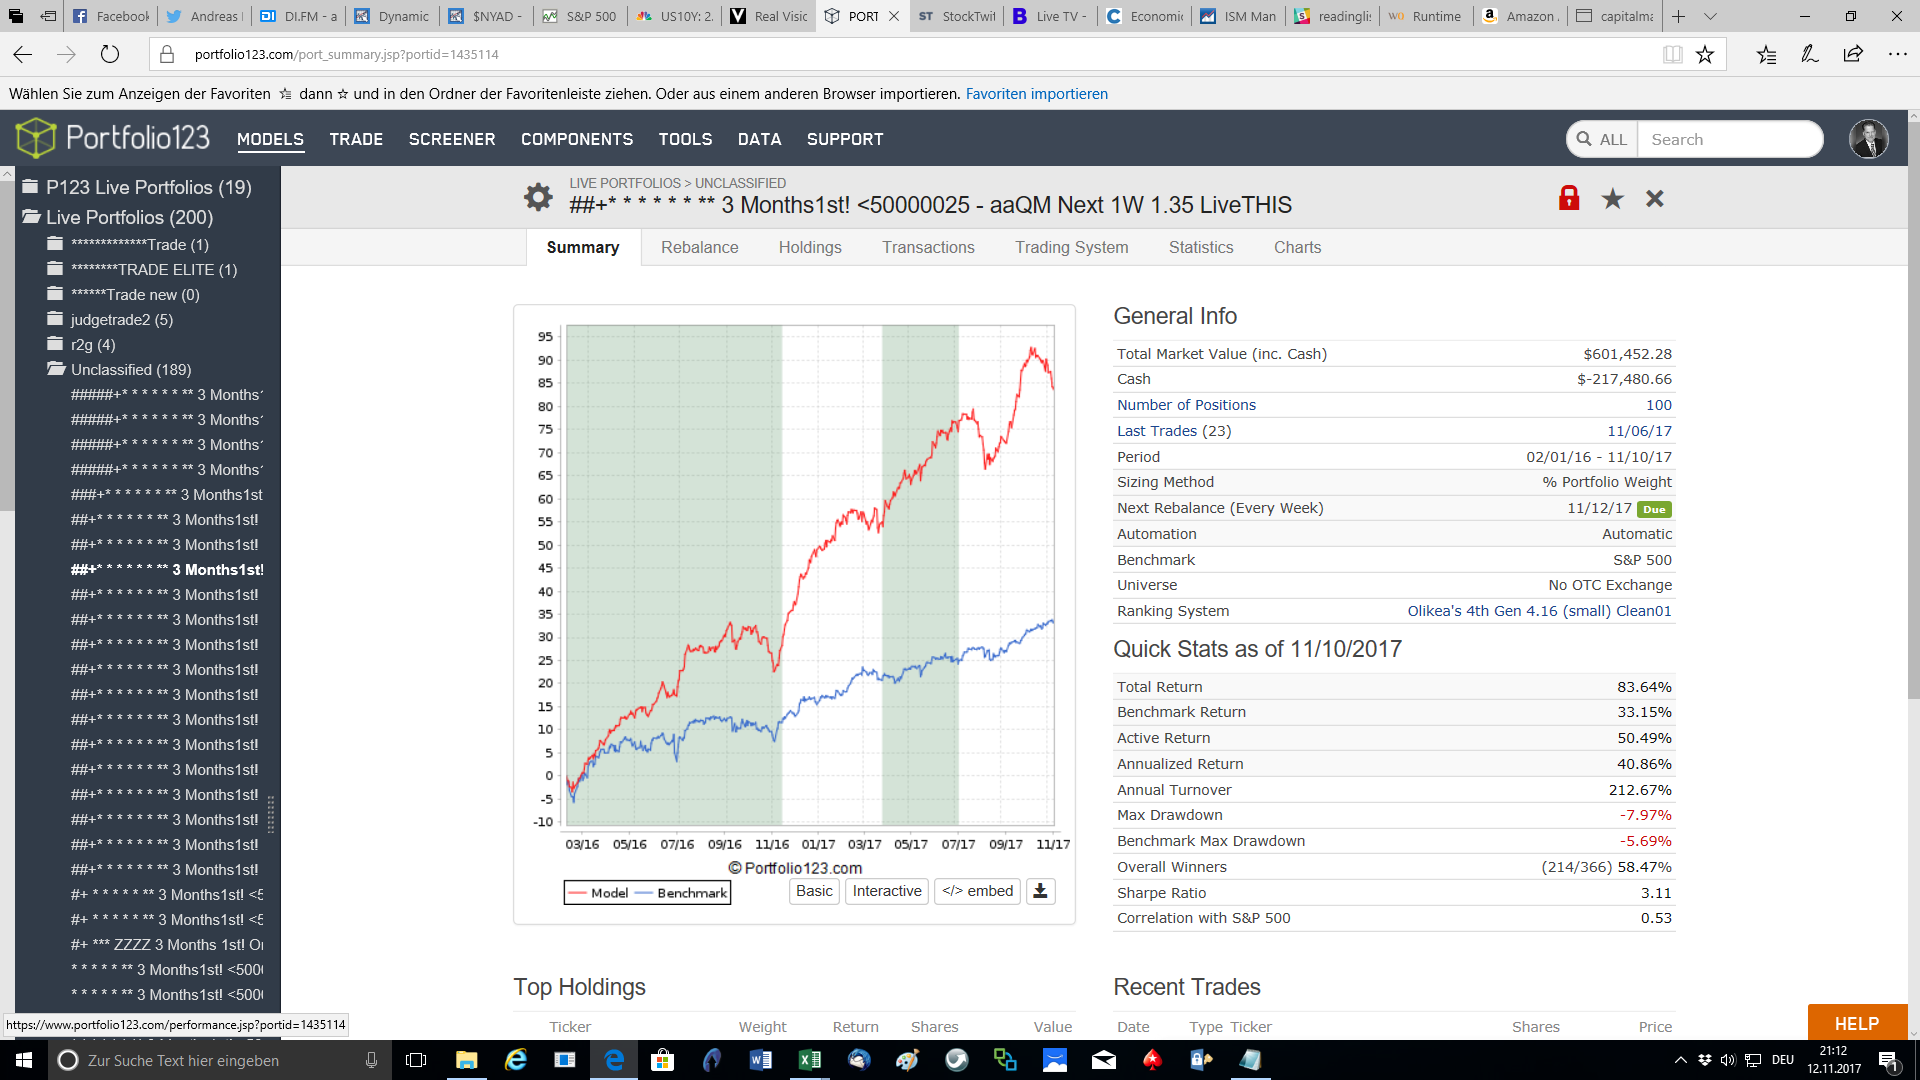
Here is my market barometer, answer the questions for your self, I get 5 Red Flags (see attached file in previous post):
1 Earnings Trending up?
2 Price SP500 Trending up? > 75 MA
3 No inverse Interest Curve?
4 Lot of Sceptical People in the Market that which good old times back
5 20 Year hard Market, 20 Year Easy Market Cycle now?
6 Do you trade by a backtested Trading System based on strong proven faktors?
Value (Backtestes since 1870 based on akademic papers?)
Momentum (Backtestes since 1870 based on akademic papers?)
Low Liquidity Small Caps (Backtestes since 1870 based on akademic papers?)
Succ. Testing 5 / 10 / 20 / 50 / 200 / 400 Stocks
Works with all official Ranking Systems of P123
Good Real Time Test
Low Correlation?
Do People / Institutions not think the system is a good idea, do people think your are and idiot?
Would People / Institutions have a very hard time to trade the system, Niche?
8 Market Leaders Lead?
9 Distribution Days not there?
10 Low interes Rates
11 Process over Result
12 Before Decision: Are you in your A-Game
13 10 Year Note below Real Growth
14 Next Generation (US) bigger then the one before (Gen Y)
15 UnEmployment trending down
16 Consumer Spending up
17 Deleveraged Households
18 Market at all time high
19 ECRI up?
You can only making money on beeing right about something most people think is wrong!
Bill Gurley
Have a good sense of where we are?
Be agressive ore defensive?
Bull Market Phases: Only a few will see improvement, 2nd stage: most people say it gets better, 3rd: everybody says everything gets better for ever
MARKET ARE THE RISKIEST WHEN PEOPLE THINK THERE IS NO RISK
PLAY MARKETS THAT ARE NOT UNDERSTOOD GOOD
bill gurley you can only make money on being right about something most people think is wrong
YOU HAVE TO SURVIVE AT THE WORST OF DAYS E:G: NOT SELL AT THE BOTTOM
If that’s a warning, then I agree. I have a market timer that’s based just on accounting data and it has gotten much weaker in this reporting period -but it’s still in positive territory. Take care.
We have seen 2 significant consolidations in small caps this year, and they seem to be amplified by your portfolio (which looks great, congrats). I don’t know if it is a signal. Up to now the Russell 2000 is still in an upward channel on long time frames.
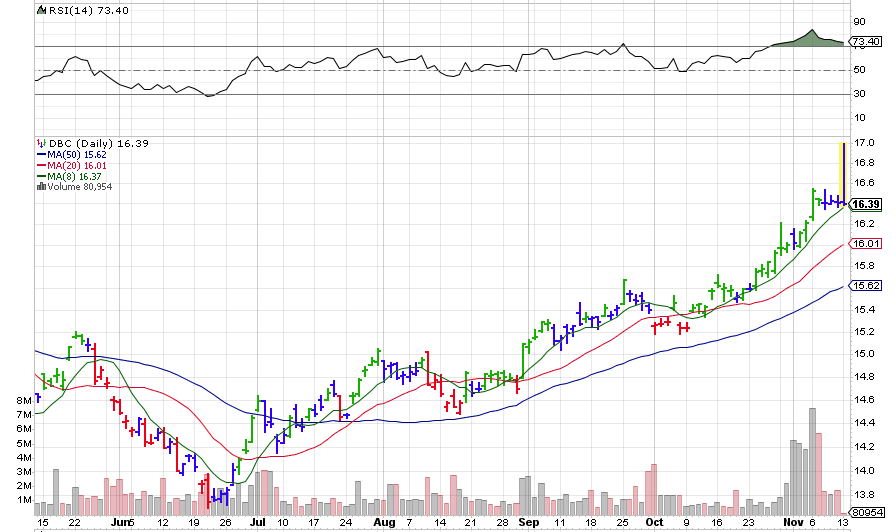
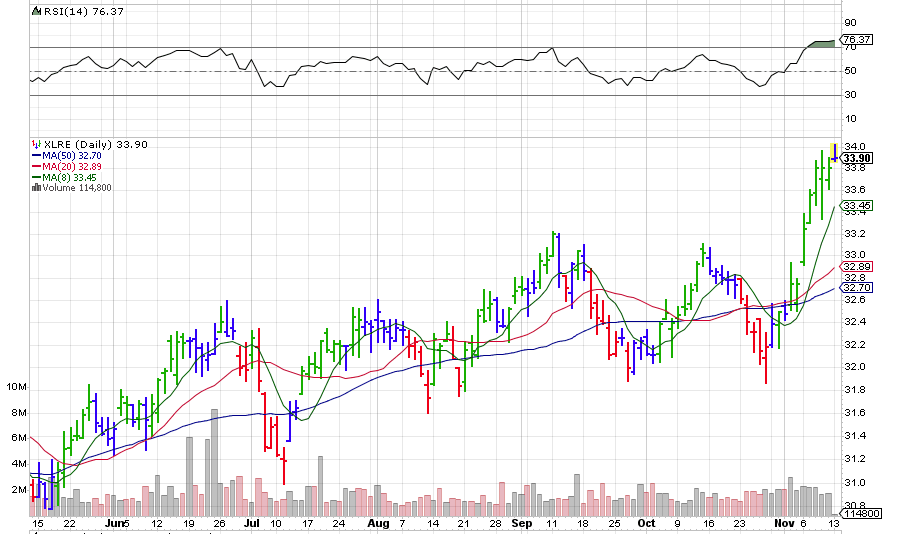
Speaking macro trends, I noted in the last 2 weeks a change in market sentiment about hard assets. Look at DBC, XLRE and related indexes in various time frames and feel free to share your opinion.
Better picture in weekly. Both broke out of previous resistances in large volumes. It’s easier to plot the start of a macro trend at the end, but people who don’t hold hard assets may miss something.
One of my value ports has reduced correlation to the S&P 500, recently. E.g., it is up today while the S&P 500 is down. Subjectively, I had thought the correlation might even be negative. But the adjusted R^2 (calculated by Excel) of weekly returns since the beginning of the year is 0.1—just reduced and not negative (R=0.35). This correlation is with one outlier removed and removing the outlier increases the correlation (would be lower).
I do know know what this means. But this is one (of many) reasons I will not be getting out of the market despite the fact that Andreas has a better record of market prediction than many—much better than me. I’m sure things will get very correlated if there is a big drawdown but it is not clear to me what my port would do with a mild drawdown.
Any general thoughts on correlations (not just of my port) and using correlations for market prediction would be interesting. For example, I have heard that general correlation of market assets is a bad sign—again not just for a single port.
thanks for your feedback, will think about it and respond a bit later, need to watch walking dead tonight
Just so much: I am not going out of the market, just want to share some thoughts… and “drawdown pain”… :-=
My market timing: as long 75 ma is not broken on the sp500 and earnings trending down, I will stay in the market…
Last week was a rough one: I lost 4.62% (over $20K) in two days (Wednesday and Thursday) on some lousy earnings reports. That brought my YTD performance down to 37%. I had a great first six months of the year but the last four months my performance has been below my benchmark (Russell microcap index, IWC). I also had a very nasty drawdown in August from which I recovered. My reaction? Just stick to what I’m doing and hope for the best. I know that at some point in my life I’m going to lose 30% or more, so it’s good practice.
If you’re running just a 15-30 stock micro port, all it takes is a few bad earnings misses to have a really bad week (I guesss that alpha comes with a price). But it seems like Q3 reports have been exceptionally brutal and unforgiving in recent years. Last year I just chalked it up headwinds from the fatigue with the US Elections. Then in October 2014 there was the Ebola panic. So hard to say if it’s a trend. Of course, the S&P didn’t suffering any headwinds, but I do wonder how earnings of the SP500 really were minus the huge tech blowouts, and if the market caps of these mega FANG giants are becoming so big they’re distorting the earnings of the broader market.
Does anyone put any value in the business cycle? If so would it not be better to switch a portion of your assets that perform well during a recession? I’m 33% bonds and 67% stock right now probably should switch to 60/40
https://www.cnbc.com/2017/06/27/op-ed-a-history-of-economic-cycles-suggests-a-recession-is-near.html
A history of economic cycles going back to the 1850s signals a bull market in the final innings
At the end of this week, the current economic expansion will complete its eighth year and become 96 months old.
The typical completed economic cycle has averaged about 58 months since 1945.
Investors need to be prepared for a very rocky period for equity markets over the coming three to five years.
28 minute mark Cowen asks him to specify a bubble out there. Assness says there’s currently no bubbles. Pinned down to name one, he says a mixed stock and bond portfolio could be a bubble. Shiller PE for SP500 equities is more expensive than ~90% of history. “Real Yield” for bonds (Bond Yield on Governent Bond - Economist Forecast of Inflation) is worse than 90% of history. A combination portfolio of 50/50 stocks and bonds the worst ever. (he then hedges and says there’s different types of expensive… ie there’s a long ways to go between 99th Percentile and 1989 Japan 99th Percentile)