Is there any way to correlate the value of a macroeconomic data point to the line item of a financial disclosure for a given reporting period.
For example, if I wanted to know what the average closing price of gold during the period covered by Barrick’s latest quarterly report, I could attempt:
SMA(63, WeeksIntoQ*5, ##GOLD)
Or the average oil price during the period covered by Exxon Mobil’s latest annual report:
But these methods are very imprecise and are not able to deal with date offsets greater than 500.
It would be much easier if there were a function to average macroeconomic data points over the time periods covered by a given “QTR” and/or “ANN”. E.g., AverageMacroData(0, QTR, ##GOLD) or AverageMacroData(0,ANN,##OIL).
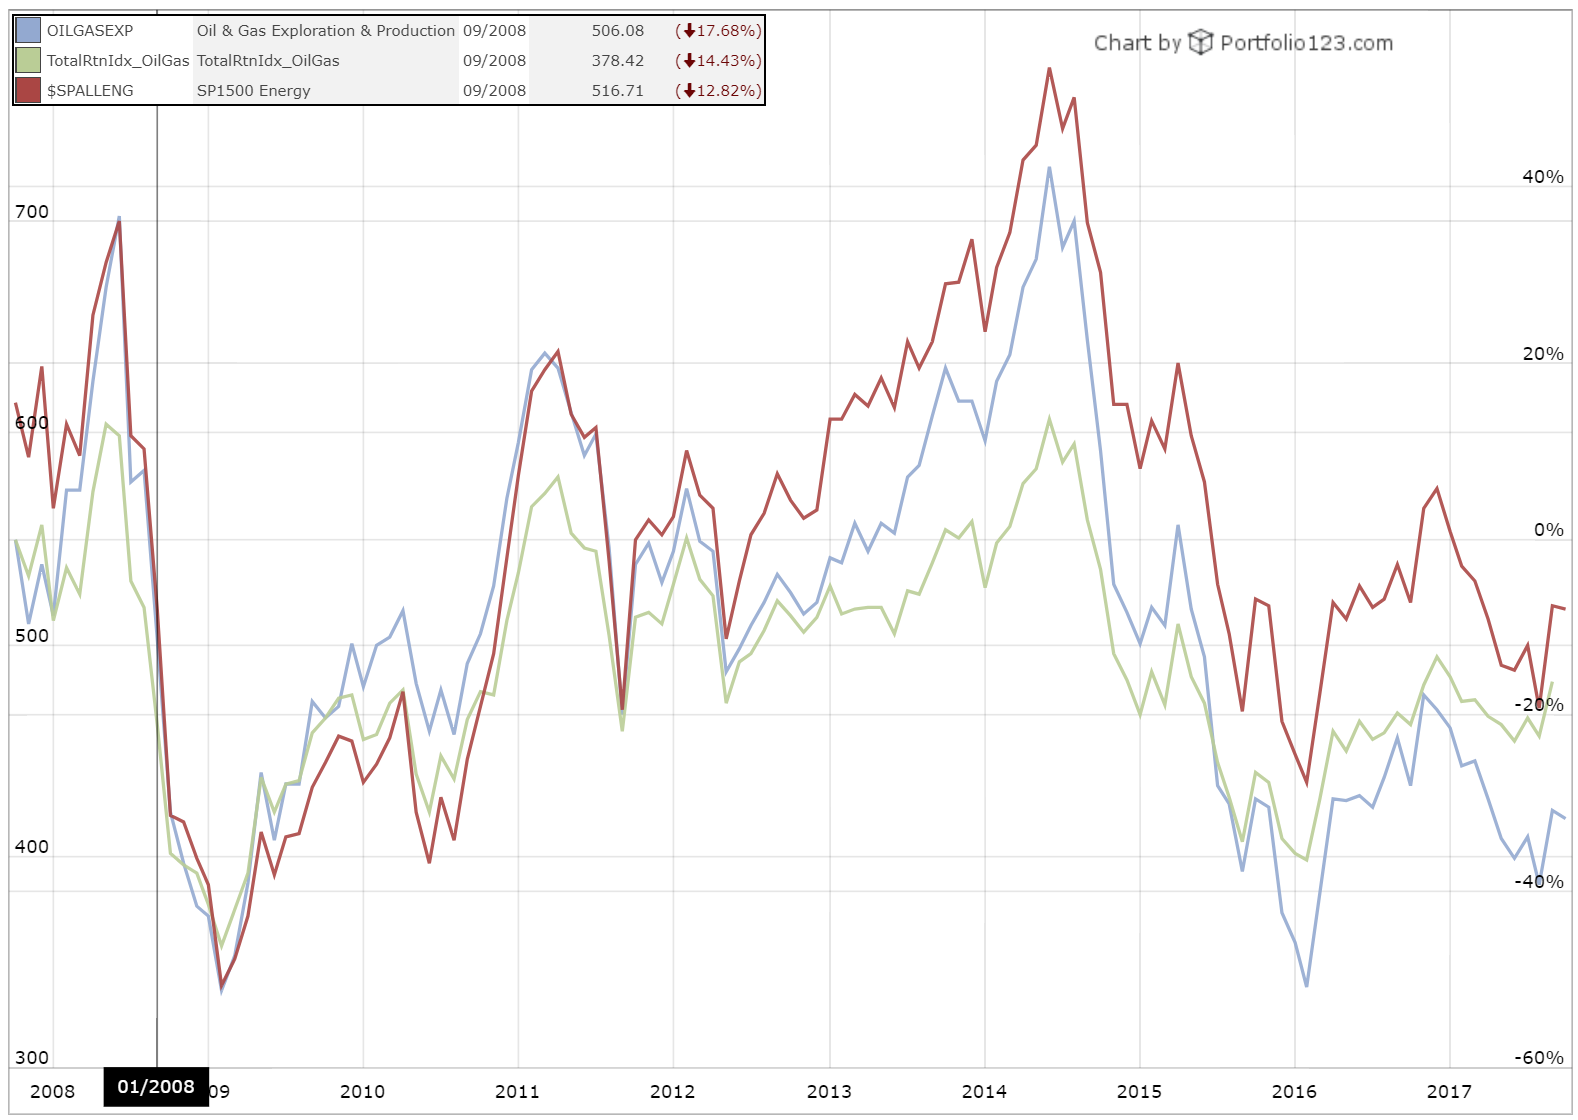
Have you tried overlaying the two series in a multi chart? That’s the only way that I can think of to do this on Portfolio123. It can’t be done as a rule without tailoring it specifically to company, economic indicator, and as-of date.
I’ve begun to dig into the multicharts tool. I really think you guys could work out a deal with SeekingAlpha to give contributors access to some of P123’s tools. Currently, it uses YCharts through the article submission system. YCharts has more data, but the data manipulation layer is not nearly as intuitive nor as versatile as P123’s.
That aside…
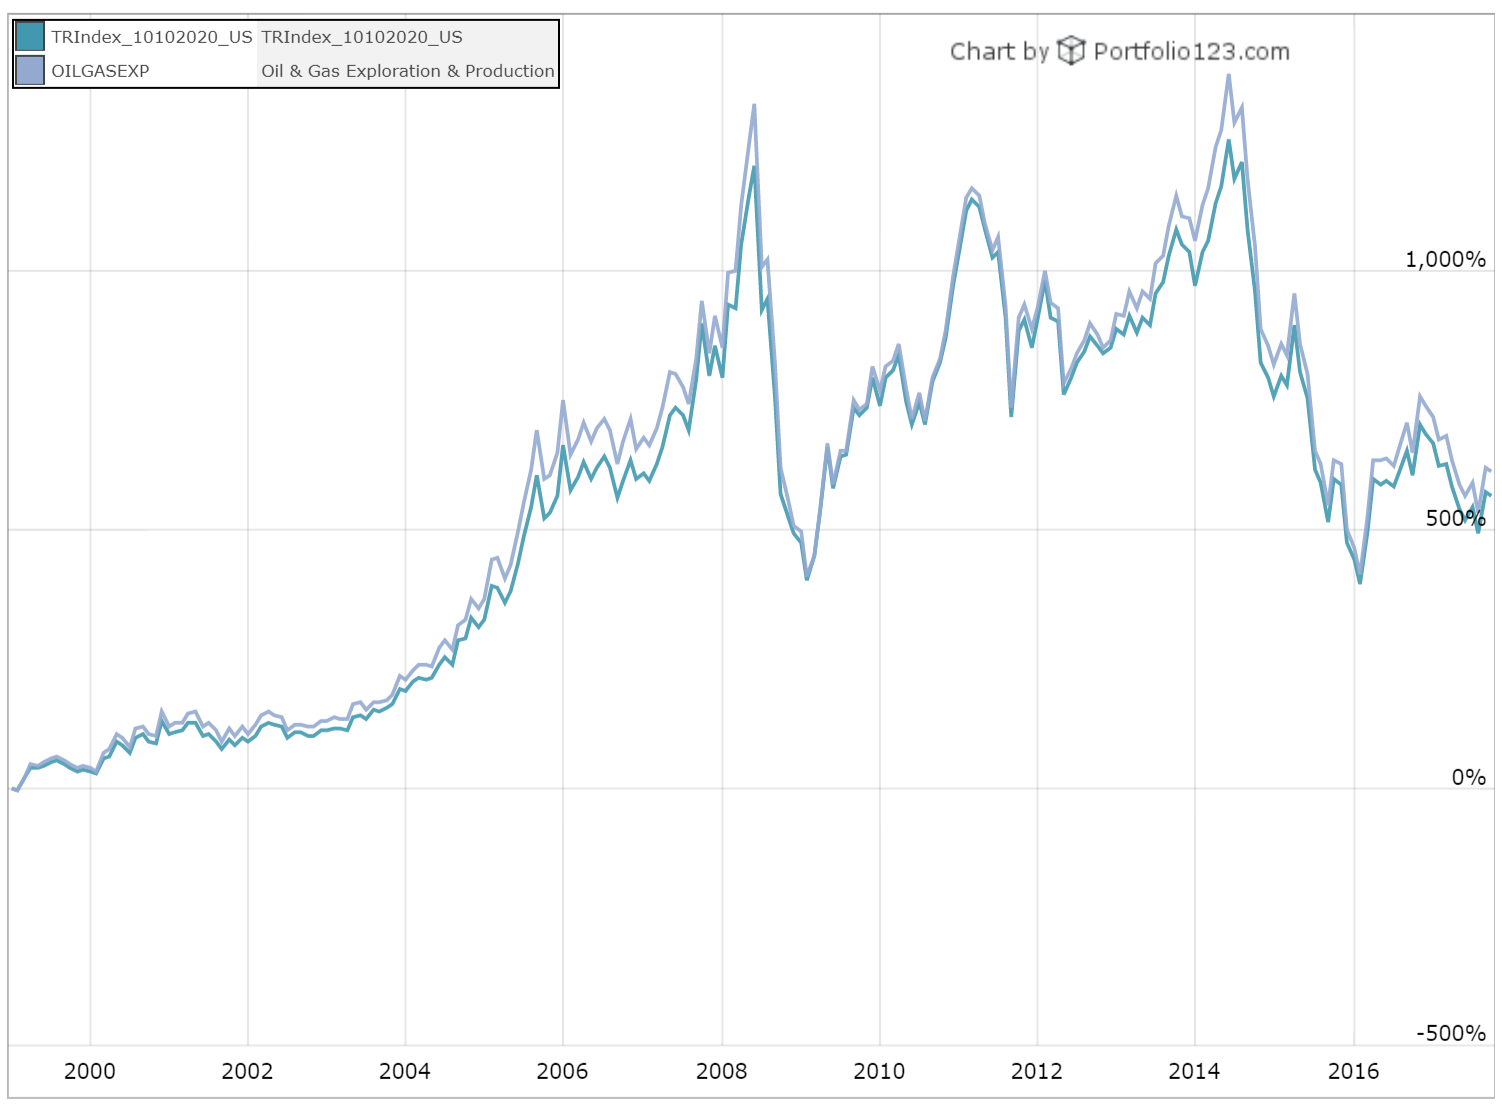
I don’t think that the MultiChart tools will work for my original intended use case, but it does beg a question: How are GICS Industry Benchmarks (custom indices) calculated?
Based on the reference notes on “Ind” factors, it appears that Industry factors (which are accessible through the screening tools) are basically trimmed means. Does this method also hold for the Industry Benchmarks which are accessible through MultiCharts?
The charts don’t use the same aggregates, apparently. Aaron came up with custom series for them. They’re basically market-cap weighted averages of the one-day price changes, excluding illiquid stocks and ADRs.