[quote]
This factor seems to work very well for every universe I test it in:
Eval(AccumDepQ = NA, AccumDepA/CapExTTM, AccumDepQ/CapExTTM)
The idea behind it is that it favors companies who are reducing their capital expenditures while retaining their fixed assets.
Does anyone have any experience with this kind of thing? Comments or thoughts?
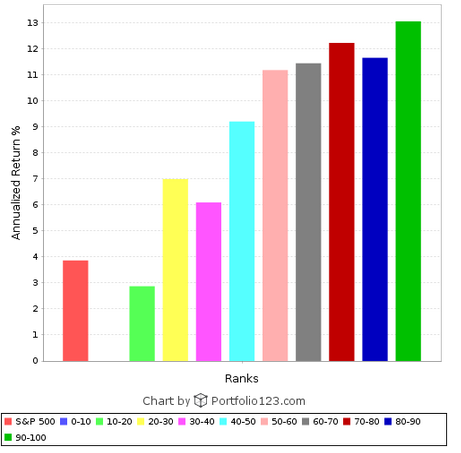
Here’s a performance chart going back to 1999 using the Russell 1000 universe.
[/quote]I don’t think it’s doing what you think it is. Just because CapEx is low compared to depreciation, doesn’t mean that the company is decreasing CapEx compared to the past.
To actually get companies that are reducing Capex use something like: CapExTTM / LoopAvg(“Capex(CTR, TTM)”, 5).
Secondly, why are you using AccumDepQ instead of annual depreciation?
Depreciation vs. CapEx background:
Depreciation is an accounting fiction. CapEx is fact.
For example, when a company buys an asset for $30 million, they take a depreciation expense every year for thirty years or something like that. Sometimes the depreciation is real, such as railroads. Sometimes the depreciation is just accounting, such as TV broadcasting towers. So, in many cases depreciation is misleading.
On the other hand, CapEx is not accurate either. Some CapEx is for growth, but some is used to maintain the existing facilities. How do you differentiate between the two? Furthermore, CapEx is lumpy. Years can go by without putting too much maintenance into an asset, but then one year it needs a whole bunch of maintenance. So, CapEx measures the actual cash going out, but it is not normalized.