When backtesting, do you pay most attention to recent (2-yr, 3-yr, 5-yr) or to the longer term (15 yr, 18-yr) returns?
Harrydom
When backtesting, you want to save a set of data to use for out of sample testing. So you don’t want to use all 18 available years for your initial backtests.
But once you’ve tested in and out of sample and have settled on a final set of rules and rankings, what you are really looking for is a return stream that beats the benchmark with some consistency.
This is measured by the information ratio, which is mean excess return over the entire period divided by standard deviation of excess returns over the entire period. In other words, it’s all important.
Please note however, that the 2000-2003 bear market was unusual. Midcap and small cap value stocks were flat from Sept 2000 to March 2003, where the cap-weighted SPY was down 45%. So don’t get too excited one way or another about returns during those years.
I have a slightly different answer. I pay equal attention to all returns of more than four years. I think the last four to ten years are just as important as the last twelve to eighteen. Less than four years won’t give you enough data. The information ratio, in my opinion, is a somewhat unreliable measure, as dividing by the standard deviation of returns introduces a level of distortion into your data, and using mean excess returns overweights positive returns and outliers. I would recommend you look at median excess returns instead.
An excellent way to go if your returns are symmetrical. I use “robust statistics” too. Specifically, I use the t-distribution (not normal with fat-tails) for some data that I expect to be symmetrical over long periods. Similarly, the median is a robust statistic that can be useful when one expects the mean and median to be the same with symmetrical returns over long periods.
In other words, the median is useful when you think you have a symmetrical distribution with fat-tails. In the absence of symmetry, your median returns will have no clearly defined relationship to the sum of your returns, and therefore, no relationship to the amount of money in your brokerage account.
Again, I encourage this and I do something similar: when I think my returns will be symmetrical in the future. I never ignore the information ratio which should, ultimately, converge to the same answer with large amounts of symmetrical data. I alway run the “robust statistics” and the information ratio at the same time. I use caution when the two methods have not converged yet—and I still hold out hope that they will.
It is dangerous enough to ignore the fat-tails. But it is an entirely different thing to ignore the fat-tails when most of the fat-tail events (black swans) are negative (asymmetrical in a bad way). You should be sure that you are not doing the latter.
-Jim
If I were told I have to choose one or the other, I’d pick the most recent returns because a starting naive assumption would be that the present and near future is more likely to resemble the recent past than the is to resemble the top-of-the-mountain view of a large time period.
That said, my real answer is that i would drop the naive assumption, give more thought to what’s likely in the near future and pay most attention to the test results for the period(s) that I think most resemble it.
The way this plays out for me, I don’t expect my life expectancy (or at least the portion of it in which I’m still in stocks) will last long enough for me to make use of the 1999-2006 period – unless I need it for purposes of presentation or publication. The way this plays out for me, 2013-2015 loom large. And then I consider 2016 separately because it has a different set of characteristics that could represent a different, but also plausible, scenario over my investment horizon.
What I do is, of course, a far cry from ideas of robustness and the like. But I’m not looking for a robust model. I’m not writing an academic paper that aims to discover universal truths. I’m now too old to care much about the long term, at least for stocks. If I were younger, my investment horizon would be longer and I’d be more open to strategies that could have five or so really rotten years but would look good over a more “complete” period – or – depending on my temperament and interests, I might still keep to limited test periods and keep coming up with new strategies as the world evolves.
Bottom line: I believe your choices here depend on who you are, what your situation is, and what you want to accomplish. If you choices of test periods are compatible with your goals, you by definition are doing the right thing, and vice versa.
Others posting have far more experience with this than me, but my $0.02 is that the early 2000s (maybe 1999-2003) seem “weird” to me from a data perspective. Oversized results from those years can skew the entire time period. A big part of me wonders if that is an era when quant investing was still young and hadn’t been figured out yet, so established factors tended to work better. Alot of factors seem to have diminished effectiveness over time, so my tendency is to give more weight to recent years than early years. It’s completely unscientific, and just thinking out loud, but I wonder if some secondary factors that aren’t dominant over the full time period might be better prospectively because they might still provide an advantage, but maybe some more dominant historical factors get arbitraged away with so much money targeting those factors now with big money in factor funds. Part of my thoughts on this are influenced by the observation that traditional factors still seem to work well in smaller cap stocks where large money has more difficulty targeting, but seem to have greatly diminished role in larger caps. Again, I’m just an amateur hobbyist, but the results seem to be whispering something of that nature to me.
Others have made this observation: Wes Gray attributes this to the inability of institutions to “arbitrage away” inefficiencies in the market. You are saying the same thing with slightly different wording I think.
-Jim
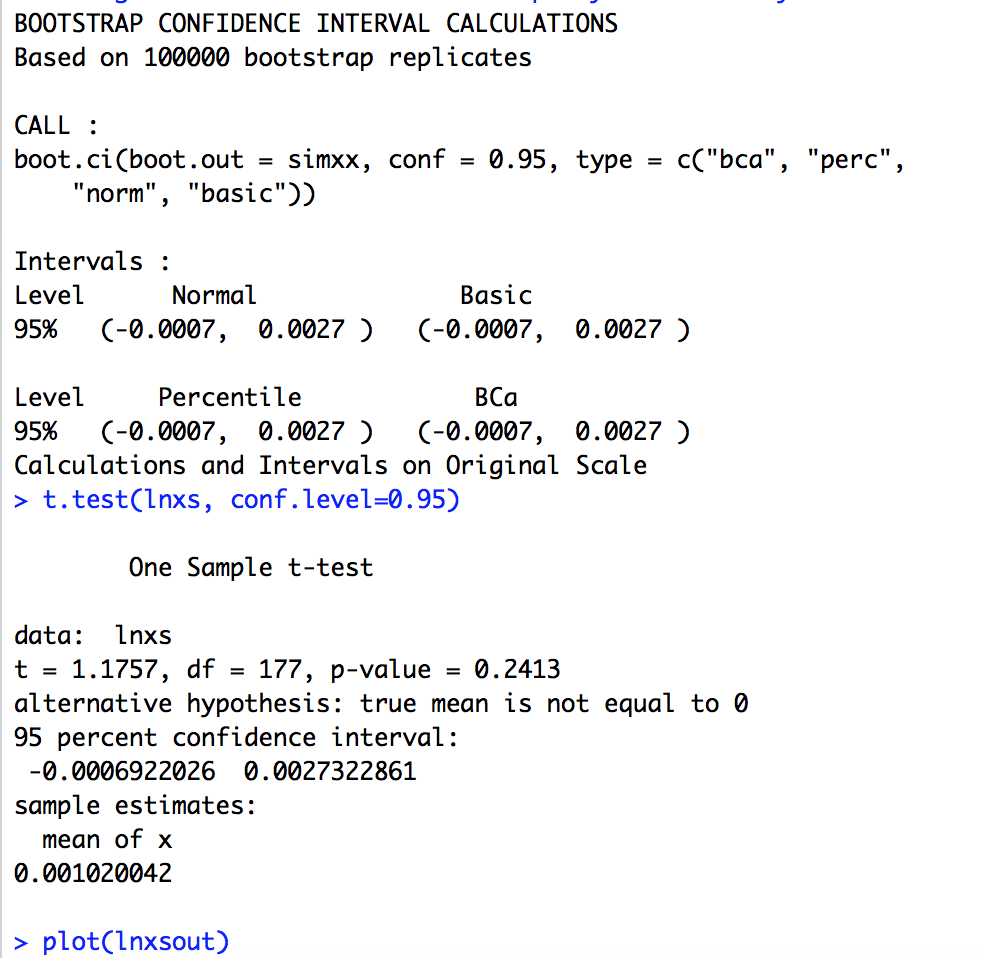
So just an example of “robust statistics” which are just screenshots of R statistics for a port I started January first of this year (out-of-sample). And I did this over the weekend before this tread was opened.
Notice that all of the different methods of bootstrapping and the t-test give the same, large, confidence interval (and is not even close to significant for the t-test).
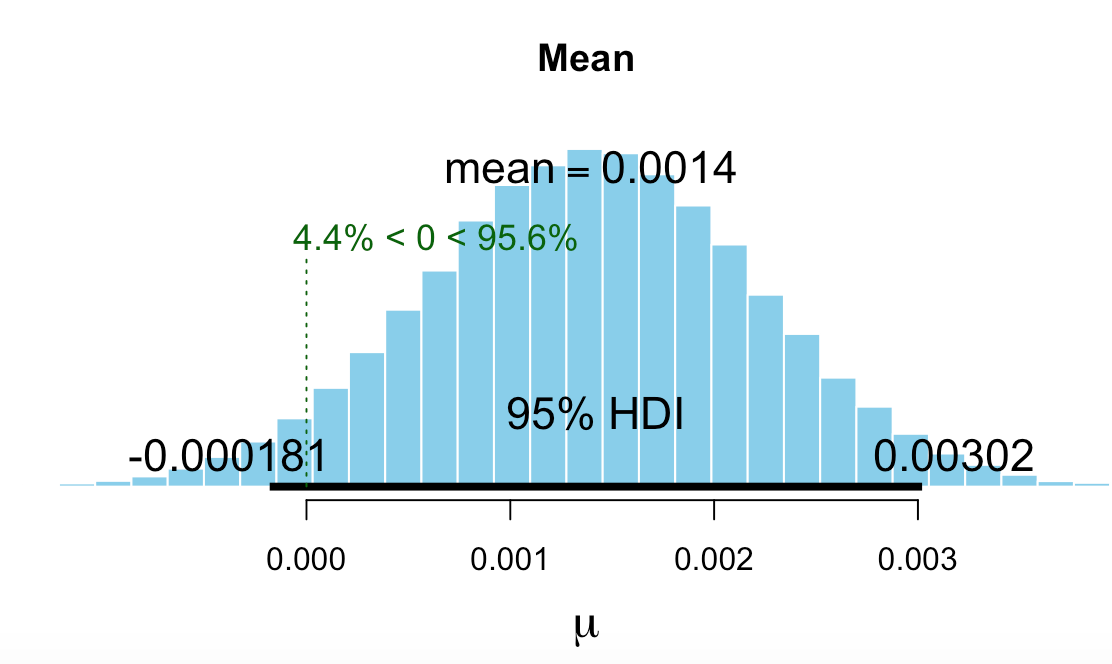
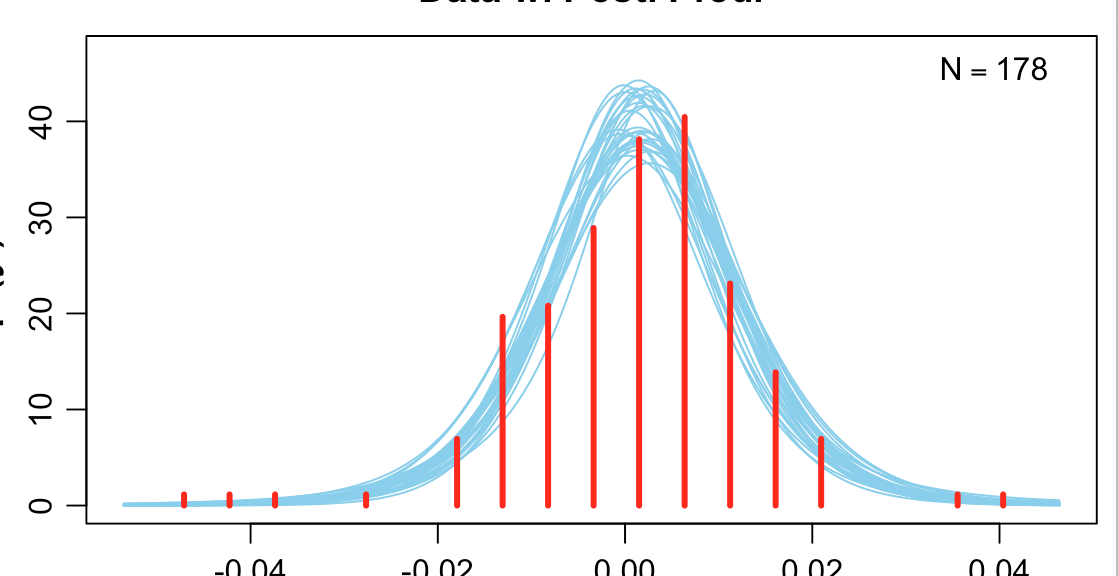
The statistics using the t-distribution are quite different. The last histogram and fitted t-distributions show how the program deals with the asymmetry, fat-tails and the fitting of a t-distribution (using Markov-Chain Monte Carlo).
Which is better? I do not know but unless the t-test and the bootstrapping come around I will drop the port. The sim was symmetrical or I would not have even looked at the t-distribution (Bayesian) method for my out-of-sample data.
Just my sincere, $0.02, opinion arrived at before this thread was started.
-Jim
I don’t usually weigh in on these discussions, but when talking to people on the phone, I’m usually pretty open about my belief that 2008 was an economic shock. That means that, personally, I test looking prior to 2008, sure, but I tend to concentrate on more recent returns as more relevant.
I think taking a factor-based approach to understanding the 1999 to 2003 period may be misleading. This was the period of the dot-com bubble and crash. There were a lot of large-cap overvalued companies, so when those crashed small caps and value stocks outperformed in comparison, particularly as that was where the smart money went. That has very little to do with factors going in and out of favor or losing their usefulness. The trick is, and always has been, to find the right balance between value, growth, quality, sentiment, size, and whatever technical factors you favor. One way to do this is to make your own benchmarks. A cap-weighted benchmark for the 1999-2003 period is going to be misleading because the dot-com bubble and crash was marked by a lot of irrationality in large cap pricing. Creating your own equally weighted benchmark out of the universe of stocks you choose from will give you a better indication of the relative performance of your factors.
Yes!
That plus the Fed’s very accommodative stance post dot-com crash (excess liquidity means more available funds for lower-quality assets, not just in housing and real estate but stocks too) made it incredibly easy for automated strategies to shine, especially when they targeted the smallest least liquid stocks. I’d push that cinderella period out to about 2006. (Even after 2006 it was still good on the whole, but mid-06 is when I first started to notice some shaking, which intensified until all hell broke loose in 2008).
Was it real? Yes. Is it likely to repeat? Eventually in all likelihood, but probably not for a very long time.
I think this is an easy call - the longer the testing period the higher the probability that your strategy will endure. Put another way, typically the worst period of any 10 year backtest is the next 10 years.
But “endure” may not be the goal.
The longer the tiome horizon, in the past and/or the future, the more lieky it is that you will havbe occassions that could be very damaging to your situation. If you have the wherewithal to wait out bad times, however long they may be, then can afford a strategy that will endure. But if you can’t, then saying a strategy is robust or more likely to endure would not serve your needs. You might have to design a strategy that sacrifices ome long-term return ion order to protect the short term.
Warren Buffett is often cited as an advocvate of the long term, but you have to read the fine proint with him. He (BRK) invests heavily on margin and benefits from the amplified upsiode. But they avoid the downside becasue the margin lender, if you want to call it that, is Berkshire’s own insurance co. So Buffett benefits from below-market cost of margin and 100% comfort in knowing he can sit with paper lossesd as deep as he wishes to tolerate with no worries about margin calls.
So in sum, your horizon is based on your needs (and the answer is different for each investor) and the test should be compatible with your horizon.