Hi,
Not sure if I am doing something wrong in my custom series.
-
I was initially looking at what the min $ daily traded is over time for a custom universe in a custom series → is that UnivMin(“1”,“avgdailytot(1)”) + a daily plot?
-
Then I started checking a few things with the PRussell1000 universe:
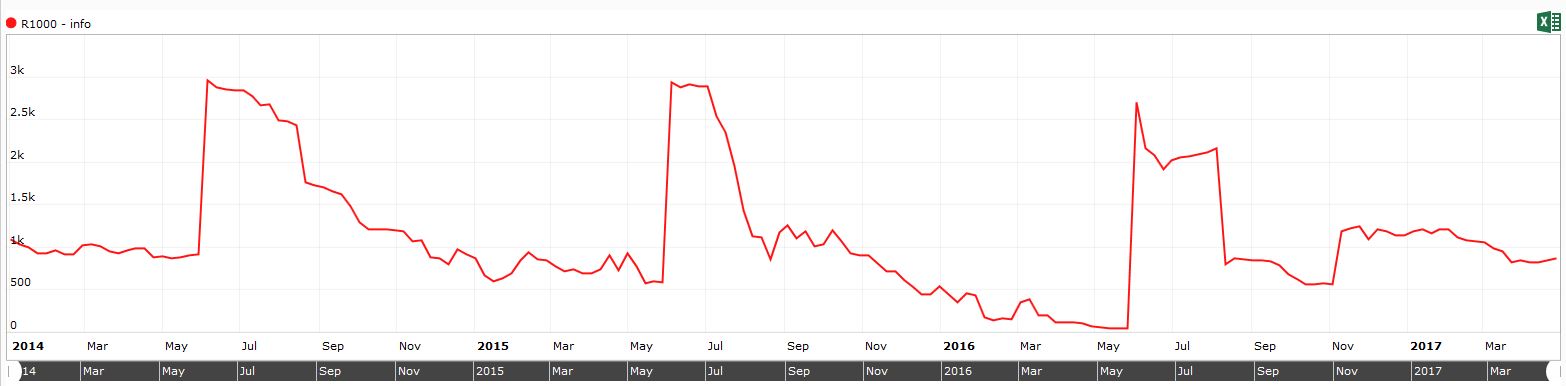
- the Min market cap exhibits quite a bizarre pattern (goes up every year late May / early June)…
- and also seems really off when compared to the numbers from FTSE Russell
For example: 26 May 2016 → Min mkt cap should be $1978m but is about $50m in the custom series
See the (public) custom series here → https://www.portfolio123.com/app/series/summary/7183?st=0&mt=8
- When I look at the min $ daily traded over time for the PRussell 1000 universe, it comes out as about $800k traded everyday (might not be the same stock every day). This feels small (and wrong?)
Is that all explained by the fact that the PRussell1000 is not an exact replicate of the Russell 1000 (and the annual “reset” of the replicate is late May / early June)? Or did I do my custom series wrong?
It seems that the differences are quite large e.g. $50m vs $1978 of Mkt Cap
Thanks,
Jerome