Bootstrapping: any comments welcome

I have been reading “Evidence-Based Technical Analysis” by David R. Aronson.

He likes bootstrapping.

I accidentally downloaded a 14 day trial of IBM SSPS and thought I might checkout one of my sims using bootstrapping.

Attached is my first test of this sim. This is the bootstrapped means of the daily natural log returns of the sim minus the daily natural log returns for SP 500 for maximum time period. So this should be the distribution of the means of the daily logarithmic excess returns.

I used a large confidence interval because I have run a lot of tests over the years. Not large enough?

If I am to get serious about using the bootstrapping what should I do next? I have 14 days to do this or pay a Bazillion Dollars after that.

BTW, I could probably run a few tests over the weekend but no credit card required—try it yourself. That is why I say accident. Before I I got to any questions about a credit card it was downloaded.

Thanks! Any ideas welcome!!!


Sorry for being an ignoramus. Can you quickly explain bootstrapping, how you’re doing it, and what you’re attempting to measure?

David,
The reason I posted is that I am an ignoramus and trying to learn. You saw the results of my first bootstrap.

From Wikipedia: “In statistics, bootstrapping is any test or metric that relies on random sampling with replacement.”

And: " It is often used as an alternative to statistical inference based on the assumption of a parametric model when that assumption is in doubt, or where parametric inference is impossible or requires complicated formulas for the calculation of standard errors."

So it does not assume normality. It does assume i.i.d. however.

I am not sure Wikepedia is too clear. It takes the data and randomly selects one of the days returns and replaces it. So it is sampling with replacement. You keep it up until you have done it the number of times equal to your original sample: Max days for P123 in this case. Then repeat for a total of 5,000 resampled means in this test—which is the number that Aronson uses in his book.

I do not pretend to fully understand. And I certainly cannot do justice to David R. Aronson’s book: highly recommended for a clear explanation of this.

Truly looking for improvements on my technique.

One thing I did learn. They say it is very computer intensive. In a sense it is. It drew over one billion days in one of my subsequent runs: trying to get wider confidence intervals and thus a greater p-value for a mean excess return greater than zero. But on my MacBook it took about 40 minutes.

And, I thought my MacBook might take off as fast as the fan was going.

But it did it. And that was worth seeing.

Did it tell me anything different that a t-test. No actually, and that is something I definitely learned.

-Jim

@Jrinne,

It sounds a lot like a Monte-Carlo simulation.

From Wikipedia :

But whereas MC methods in finance usually measure the a sampling distribution for the value of a thing, it seems like bootstrapping is geared more to measuring the significance of a thing.

Are your sample statistics for the p-value or mean? How are you measuring the mean (i.e., percent or logarithmic)?

David,
The mean of the daily excess natural logarithmic returns (S&P 500 as the benchmark). The “detrended” logarithmic returns as Aronson puts it. Looking at the 99.9% confidence interval in this case.

BTW, IBM SPSS would not let me go above the 99.9% confidence interval saying there were not enough samples. So I ran 250,000 bootstrapped population samples. Even though I was able to heat my house with the heat from my processor it was not enough samples to get the program to calculate the 99.95% confidence interval.

And I want it to show me a histogram: I will try to get it to do that this weekend.

Still, I want to get enough money in the stock market so I can pretend to justify getting this program! I think Aronson has done excellent work. So I think it can be useful. I have not proven that it is useful in my day-to-day decisions or for selecting a port.

It is good to know that the lack of normality and those fat tails may not be a deal breaker.

-Jim

Jim,

Have you considered R instead of SPSS? R is open source, and you can buy find many excellent textbooks and blogs/forums answering almost any question related to R.

I can strongly recommend the book “R in Action” by Robert Kabacoff. It takes the novice from the very basics to advanced statistical methods. Chapter 12 of this book is about permutations and bootstrapping, providing detailed how-to instructions and examples with code.

I cannot provide any recent comparison of SPSS and R, as the last time I used SPSS was in 1997 at university (damn, I’m getting old…). R has a significant open-source competitor in Python, and you can find epic fights on the Internets about which one is better. After getting started with R, I briefly looked at Python, but could not find any meaningful difference for my use.

Best,

Guenter

PS: Recently, Walter brought Safaribooksonline.com to my attention, and I have subscribed for $399/year. Safari offers all kinds of e-books on finance and programming, including both “R in Action” and “Evidence-Based Technical Analysis”. I think your ROI on this expenditure is much higher than spending $1200/year on SPSS :slight_smile:
.

Guenter,
Thank you!
That sounds like the way to go. I will download that and start learning it at work. Will probably mean “bootcamp” for Mac to bootstrap at home. But definitely the smart way to go.

Thanks for the other ideas too!

BTW, you probably already know that it was your post that made me aware of Aronson’s book: a string of great and helpful ideas!!!

-Jim

Justy a reminder, even the best statistical practices can produce bad results if they are applied to situations that are not compatible.

I.I.D. and randomness are not parts of the world of the financial markets and this is probably why famous quants have had much more success publishing books and papers than they have in producing real-world dollars and cents results. There’s a big difference between saying something is random versus saying something has definite causes but it’s hard to identify and define them in advance. We wrestle with the latter.

I suppose this is a good time to catch up on something I had forgotten to mention. I added an Introduction to the on-line strategy design class. It’s available in in Help>>Tutorials>>Courses>>Portfolio123 Virtual Strategy Design Class. Hopefully, it will help frame the nature of the research endeavors we undertake and make it clear that randomness and I.I.D. are not part of our world.

Marc,
Just want to say I agree with you.

Not that I have succeeded but using bootstrapping, smaller p-values etc are all attempts to avoid some of the pitfalls at least—e.g., normality assumption and excessive data mining leading to “alpha inflation.”

Still I may not have adequately addressed other issues—as I have said—like i.i.d. I do not try to hide this.

I do not want to give details. But I have found things with Excel spreadsheets that have proved statistically significant. Things that cannot be tested using P123. Things that can be shown to have made me money using simple accounting—so for anyway. Things that can be found in the literature but that I found only after becoming aware of them by looking at my trades in a spreadsheet and doing a search on the findings in the literature.

Furthermore, even bad statistics can tell you things. Maybe a regression cannot be done due to outliers and lack of linearity for example. But it can still be good to ask: “What is that extreme outlier doing there?”

The so called “French Paradox” that found a low incidence of heart disease in French people is an example. It is speculated that the French people have less heart disease—and are extreme outliers despite other risk factors—because they drink wine. I am not so sure that regression was really legitimate and maybe should have been thrown out of that paper. But is has the undeniable benefit of giving me an excuse to drink some wine now and again;-)

We are programmed to see patterns that just are not there–as Aronson points out. Any statistics that identifies these false patterns is good.

But we also miss pretty extreme patterns if we do not look for them. It can be shown that we humans regularly miss things with up to .70 correlation unless we look for those correlations.

Don’t even get me started on the fact that much of what is published and is supposed to work does not work in some ports while it works just fine in others. Or sometimes it is so well understood and published that following the herd is actually harmful. Not trying to sort this out is just laziness. Without a doubt an advanced degree in finance is the best way to get the best answers. But will that answer all of my questions on short-term and long-term momentum after I am done?

So I will not give up on the statistics—I know you are not recommending that I do.

-Jim

@Jrinne,

So… am I getting this straight? You have excess returns which, when annualized, are e^(m*252) of your daily excess natural logarithmic returns with some light assumptions, which at p-value = 99.9% equal 13%? Is this real-world after transaction costs? If so, can I just give you my money???

Also, I can second Cyberjoe’s motions for using Python or R. Of the two, I prefer Python because it’s more general purpose (and the syntax is also much cleaner). Someday, you may want to use a language for something… I dunno… other than statistics?

And thirdly, I agree with Marc G’s views on the mis-assumptions of normality. But a far worse thing is to overfit the data – using higher level sample moments, for example – if a sample distribution is not normal, then adding skew and kurtosis to a normal distribution doesn’t fix the problem (i.e., Post-Modern Portfolio Theory is post-mortem). The key, though, I think is to be able to differentiate models from reality. This sounds easy enough, but the troubles come from the fuzzy lines we draw between models and reality. Is not a sufficiently detailed model of the universe indistinguishable from the universe? I’m not saying we live in The Matrix, but I am saying that you and I have a vested interest in simulating reality as closely as possible. When models become sufficiently reflective of reality, human psychology has trouble distinguishing between the two.

Btw, I am semi-serious about the money thing.

David,
Good post. Let met start with the most interesting question first:

I do too. That is the reason for using bootstrapping. If I were not concerned (I am) I would have used a simple paired t-test of daily returns of my sim and my benchmark.

I hope people more knowledgable than I am will comment on how well bootstrapping addresses this issue. Getting those comments is the purpose of this post.

And I do not limit my concerns to questions of normality. I take all of Marc’s concerns seriously and rather than ignore them I like to look at them. When I can, I will do better statistics. Otherwise, I will “fudge down” my estimates when I cannot calculate objective numbers.

In the meantime should I just sit and watch CNBC and let them site their correlations thinking that they have somehow done it better? Always safe to follow the authority figures and the herd in general, I think. You should always just use their statistics. Or better, just let them tell you the way it is.

Naw. That is no fun. I’ll go down using my ideas if I go down.

I think the math is correct. This is absolutely not anything out-of-sample. It is a sim. A serious sim with variable slippage etc but just a sim.

As with most sims at P123 I can guarantee a few things. 1) It will revert to the mean. 2) There is—at the very best—data mining with guaranteed “alpha inflation.” If you adjust the p-value based on the number of trials the p-value needs to be adjusted at A LOT.

I made the interval as wide as I could with this program (or my present knowledge of this program) to address this "alpha inflation’ problem.

Also, I think overfitting is a slightly different topic than “alpha inflation” but however you view that there is always some overfitting too.

Finally on confidence intervals. I look forward to the day that a port performs near the upper range of a confidence interval over a reasonably long time-period. I truly look forward to it but I have not seen it yet.

All that having been said, it remains possible that–as the statistics suggest—it will beat the benchmark.

I absolutely will do one or both of those-starting with R, I think. I had kind of looked at R before. But that is why I post. I get great ideas and suggestions and this is obviously a good one.

David. On a separate topic: slippage. I did not post on your thread because I think you are talking about different liquidity than I have experience with. But, depending on how you measure your slippage, it is possible to get to pretty accurate numbers—with a small standard error—pretty quickly.

Recommendation: Make your best estimate on slippage. Start a little small so that any errors do not cost you much. Then adjust based on your data. Surely, we can all agree on this use of statistics.

-Jim

Wow!!! Thank you Guenter!!!

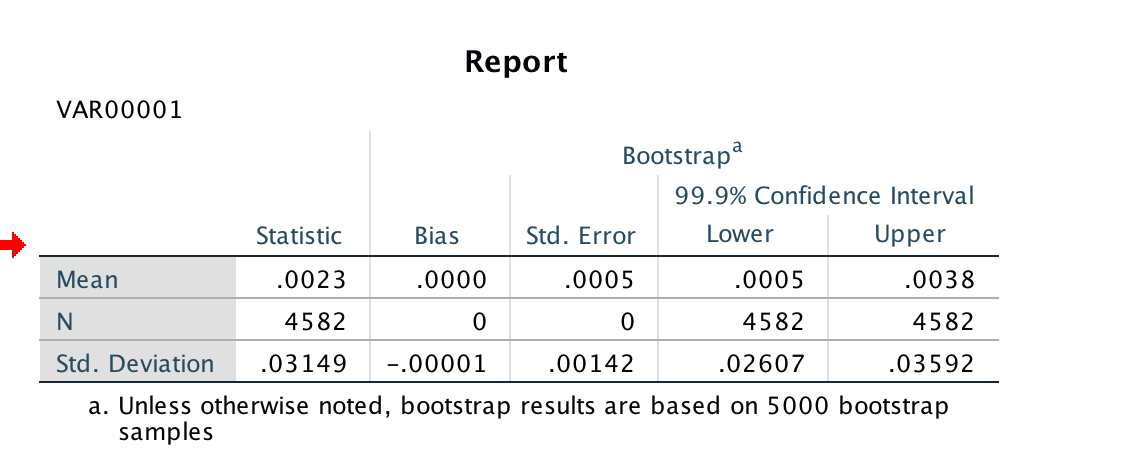
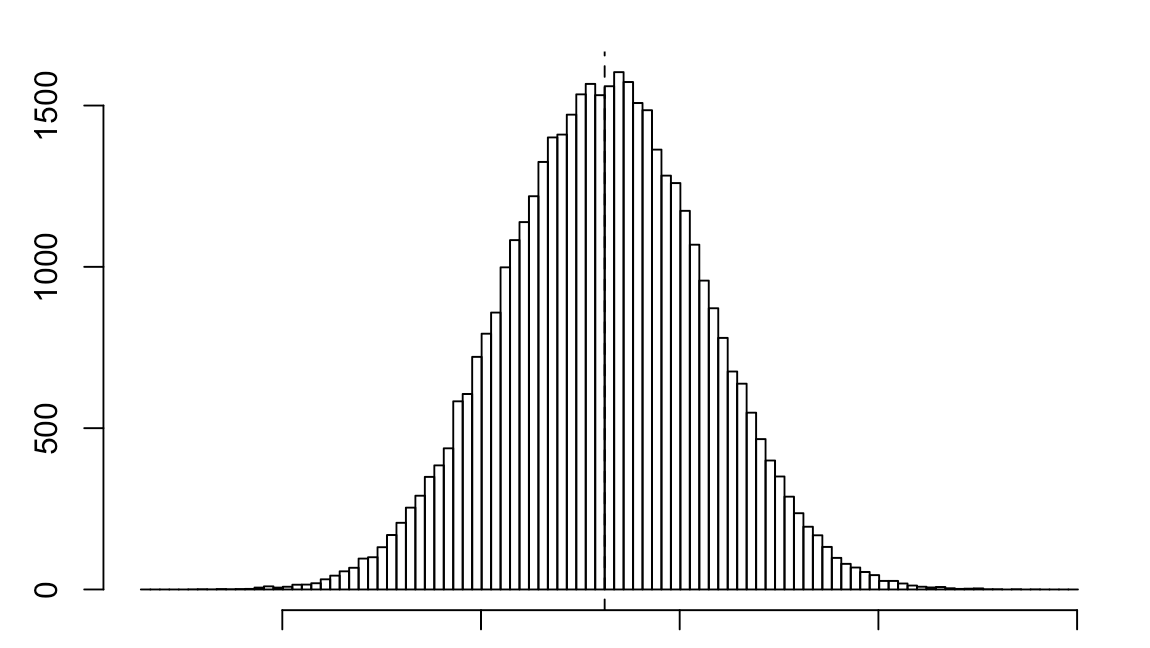
Just finished my first read of Aronson’s book and started with a little bit of his type of analysis: see above bootstrapping.

But his book is not about bootstrapping. Well, it is about a lot of things.

People should read this book to understand DATA-MINING BIAS. I have called it regression toward the mean. What I have called it often relates to other issues and is a very poor term. Read the book and let someone who really understands this go through it. I am a neophyte and not necessarily the most promising one at that. But people who have not read the book and just look at the pretty graphs on P123 are at a disadvantage.

If I have taken away nothing else from the book it is that: “The data miner’s mistake is using the best rule’s back-tested performance to estimate its expected performance.”

We all kind of know this. But he shows why this can never be avoided. Accepts it, and moves on to doing the best data-mining possible.

In other words, use the annualized return as part of your decision as to which sims to turn into ports but never use the annualized return as an estimate of your future return.

Now onto a few minor things:

With regard to normality. Non-parametric tests of the above example sim using SPSS continue to show a good p-value. But also using a paired t-test gives the EXACT SAME confidence interval as the bootstrapping: I looked at a 95% confidence interval for this. However you look at it, normality does not seem to be a big issue. However, bootstrapping is intended to take into account fat tails and did accomplish this in some of my anecdotal tests (I do not think SPSS is the best program for bootstrapping either). But generally speaking the central limit theorem really is a theorem and not just someone’s opinion.

On i.i.d. This is to be taken seriously. By accident and because I mimicked what Aronson had done I, at least, made my analysis stationary. This is because he uses differencing and detrending. And as I understand it using natural logs may help with this too. I will keep learning about this.

Finally, I do not think this argues against anything Marc has said. If anything it strongly makes his point that statistics can be very badly misused. We may—or may not—have a minor difference of opinion on whether properly done statistics can ever tell you anything.

But I think Marc and I would probably be in agreement that if I show you a sim in isolation, claim it is good and say “I have proved its value to the p < X level of significance and you can expect this kind of return going forward” it is …… Well, I’ll let Marc use his own expletives on that: I would not be surprised if we are using the same ones.

Aronson’s book could even be used to show why doing very few backtest and no data-mining works: as it does for Marc.

Also a careful read of the Data-Mining Bias would make one want to use rational rules that have the highest chance of being effective (best Bayesian priors).

These are the rules that Marc is recommending based on a great deal of experience and education. I use them: see above about being a neophyte and not the most promising one at that, however.

Thank you Marc, David (Primus) and Guenter. Discussing this is a big part of my beginning to understand it. BTW, you can do R on Macs (thanks).

-Jim

Good luck, Jim! Sounds like you have an exciting journey ahead. I haven’t read Aronson’s book, but it’s on my Amazon wish list. I am much more heavily invested in commodities-based business valuation. It’s sucks. Don’t get into it. In my experience, it’s far better to be a generalist investor – more opportunities, less backlash from being wrong, only required to be generally right, etc…

All:

I take bootstrapping very seriously. In particular, I use R to “rebuild” the equity curve a 1000 times. I then analyze these curves for various metrics including return and peak-to-trough drawdown. In my experience “good” systems show roughly normally distributed returns over shorter time frames and roughly exponentially distributed drawdowns in the tail of the distribution. This is one of the reasons that I have high confidence in the systems I trade.

Bill

I’m wondering if any of you can explain this to someone whose knowledge of statistics doesn’t go beyond what’s available on Excel. I’ve read this thread several times and I can’t figure out what bootstrapping is. Or what an equity curve is. Or what p-value and t-test mean. Or what an I.I.D. is. I take it R means correlation (as in r-squared)? When I look these up, I get just as confused. What does randomness have to do with P123 results? Do I need to take a stats course, or can someone explain in simple terms what you’re doing? Are you manipulating screens and/or simulations in Excel (which is what I do)? Does this have anything to do with alpha and standard deviation or is it something altogether different? And isn’t applying statistics to technical analysis like applying Newton’s laws of motion to astrology?

Yuval,

I’ll have a go and try not to confuse you …

Standard statistical methods that test hypotheses or estimate confidence intervals assume that the sample data is from a so-called normal distribution. Unfortunately, this assumption is not 100% true for stock market return data. Returns have usually fat tails and are skewed.

Therefore, the traditional way of calculating hypothesis tests or confidence intervals leads to “wrong” results. It usually underestimates confidence intervals, misleading investors.

Bootstrapping is a method that does not assume a normal distribution. This method can be used for data sampled from unknown probability distributions, or small samples, or samples with outliers (common in return data).

Bootstrapping basically creates a distribution of a test statistic by repeated random sampling with replacement from the original sample. Without making any assumptions about the underlying theoretic distribution, confidence intervals can be estimated based on the distribution of the test statistic.

A confidence intervals describes the range of an (unknown) population parameter based on a random sample. Roulette is a good example. If you spin the wheel 10000 times, you would expect the number of zeros to be “close” to (1/37)*10000 = 270 (never been to Las Vegas, but I think American roulette wheels have 2 zeros, so the expected number of zeros would be double). Confidence interval methods calculate the probability that the number of zeros will be within a certain range. In the roulette example, the number of zeros can be expected to between 240 and 300 in 94% of cases. So, if you play at a table for 10000 spins, and the number zero comes up 290 times, you would say this is as expected. If the zero shows up 310 times, you should have strong doubts about the fairness of the table.

As for Jim, he can make the assumption that his excess returns are 0. Sometimes, the excess returns are a bit higher than 0, at other times, they are a bit lower than 0. Bootstrapping is expected to confirm if his excess returns are statistically significantly different from 0 – or not.

As for some of your other questions:

  • R (capital R) is an open source software for statistical analysis.

  • R squared is the proportion of the variance of a dependent variable explained by the independent variable(s). This statistic is used to describe the quality of a regression model.

  • i.i.d. is the assumption that variables are independent and identically distributed.

  • t-test and p-value are terms used for hypothesis testing.

PS: Statistics is not that hard to learn. A good college textbook and a few weekends should be enough. You will benefit a lot. It will make you smile when people sell their stocks, because the unemployment rate is 0.1 percentage points “higher” than it was three months ago.

Thank you! I will definitely try to learn some more about this. - Yuval

y:

There are also free/low-cost online classes. You might want to check out Coursera or Edx. C: you did a really good job of explaining a lot of not so simple concepts.

Best,

Bill

After learning a little bit of R I was able to get a histogram of some bootstrapping results.

The central limit theorem is alive and well. There is no doubt that the distribution of daily stock returns is not normal.

But 100,000 sample means with 4585 daily returns in each sample (i.e., MAX period on a sim) is looking pretty normal to me. The central limit theorem does turn a non-normal distribution into a normal one when there is a large sample size, it seems.

Conclusion: as long as you are talking about large sample sizes there is not a lot or error introduced by just using Sharpe Ratios, t-tests etc (without bootstrapping), I THINK. Bootstrapping is cool, however.

BTW, R is much, much, much faster than SPSS at this.

-Jim


CoOoOoL.

By the way, one of the side-effects of the central limit theorem is that a random sampling of sample means will approach a normal distribution as N → infty no matter what the underlying sample distribution looks like (or sampling distributions provided they are i.i.d.).

So… burning question… what is the so-what factor from these tests? How does it affect how you are going to invest?