I looked at my slippage for almost all of my trades for this year with respect to the different groups in the Tick-Pilot Study.These were window trades. “Almost all” because I was lazy a few days.
As you all probably remember there are 4 groups counting the control group. The G1 group requires the prices of stocks be quoted in nickel increments but can actually trade at any value.
The rules for groups G2 and G3 are more likely to affect slippage, IMHO.
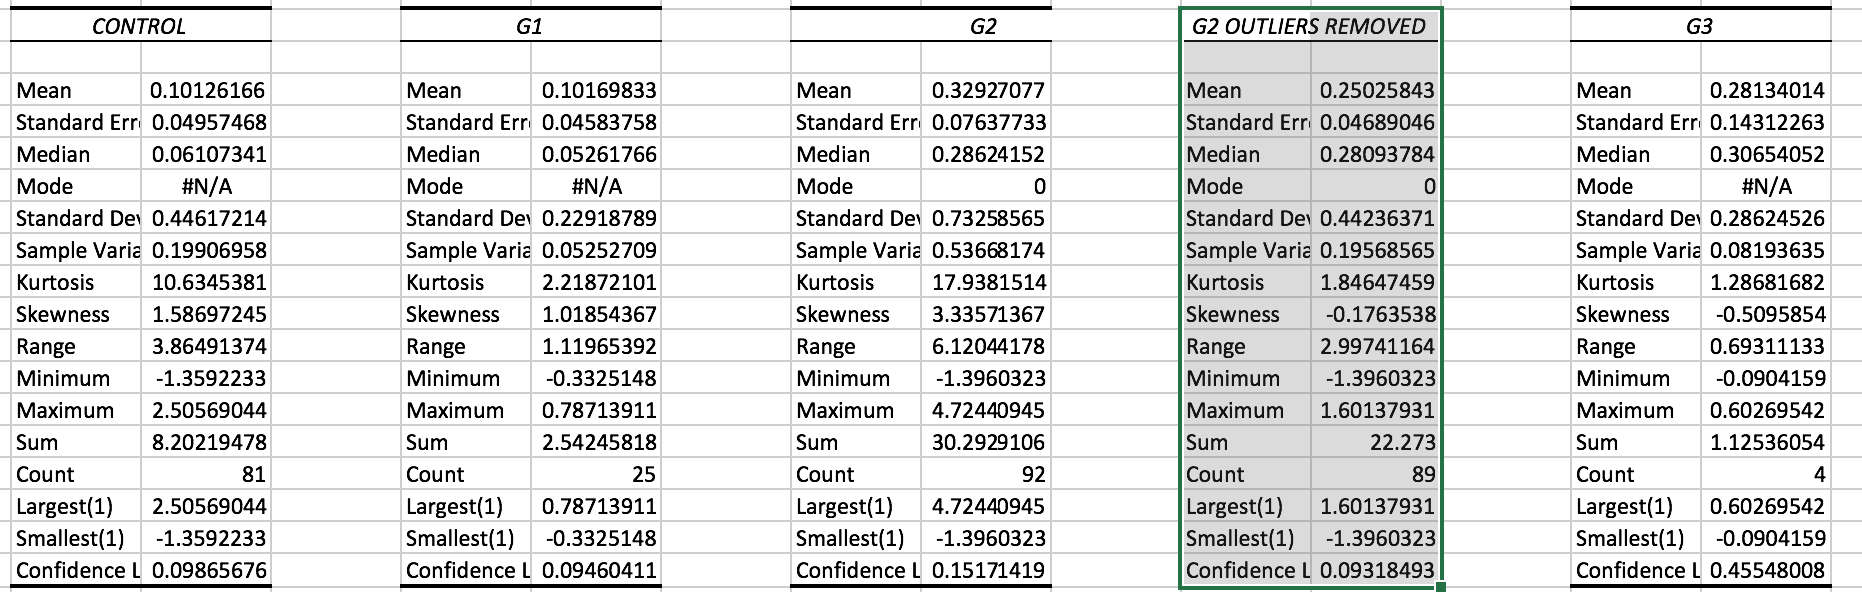
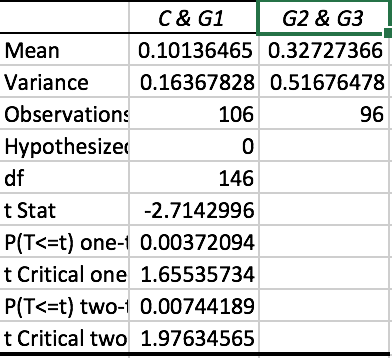
In the below attachments you will see the descriptive statistics for each group. The next two attachments are t-tests done with Excel.
G2 had two trades that were very significant outliers (excessively high slippage). “G2 with Outlier Removed” is just as it says: these 2 outliers were removed. I did a t-test comparing the controls and G1 in one group to G2 and G3 in the second group. I got significant highter slippage for G2 & G3 combined.
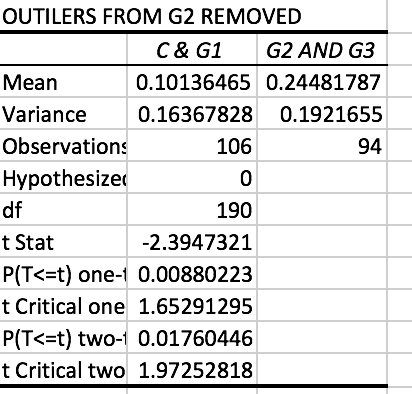
I worried about the outliers and compared the controls & G1 to “G2 Outlier Removed” and G3. The difference continued to be statistically significant. I show the results with and without the outliers removed
The results with the outliers removed showed a meaningful difference: 0.10% compared to 0.24% or a difference of 0.14%.The slippage is more than doubled!
Statistically speaking I conclude: WE ARE BEING SCREWED (if anyone is offended by that I will edit it: just comment). p = 0.02
I also added some trades from last year and the significance increased. But I was using a different universe last year and the mean slippage was affected. So I only reported this years results.
Weakness: The decision to combine the groups is reasonable but was not decided at the onset of the study.
Ideally, I would start a new study on Monday and report after a defined time-period such as the end of the year. I will combine the groups as I have done in this study.
If I do this I will likely be able the confirm: WE ARE BEING SCREWED!
Respectfully,
-Jim