Has anyone found a good market-timing signal using the yield curve? What does it look like? Not looking for short-term timing necessarily, just something that would keep one out of bear markets, e.g., 2000-2002 or 2008-2009.
Thanks,
Ed
Has anyone found a good market-timing signal using the yield curve? What does it look like? Not looking for short-term timing necessarily, just something that would keep one out of bear markets, e.g., 2000-2002 or 2008-2009.
Thanks,
Ed
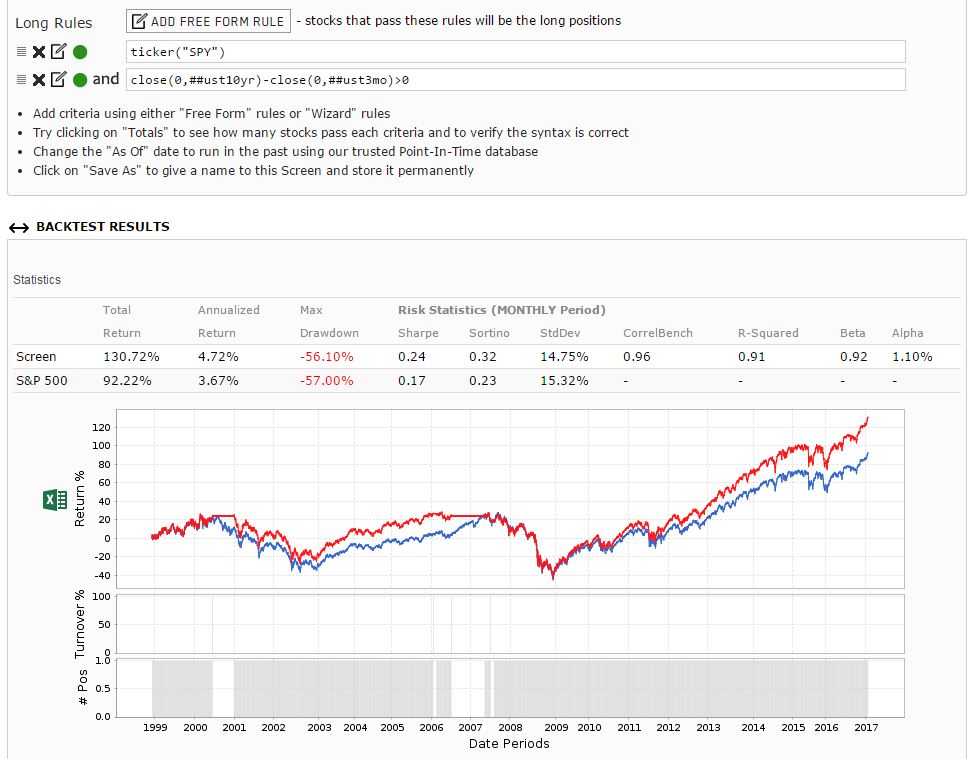
10 year minus 3 month below zero:
https://fred.stlouisfed.org/graph/graph-landing.php?g=cDvL&width=670&height=525
Thanks but I’m afraid I’m not following. What’s the net yield threshold for being in/out of the market, and how does the performance of a hypothetical portfolio look using that threshold?
Great, thanks.
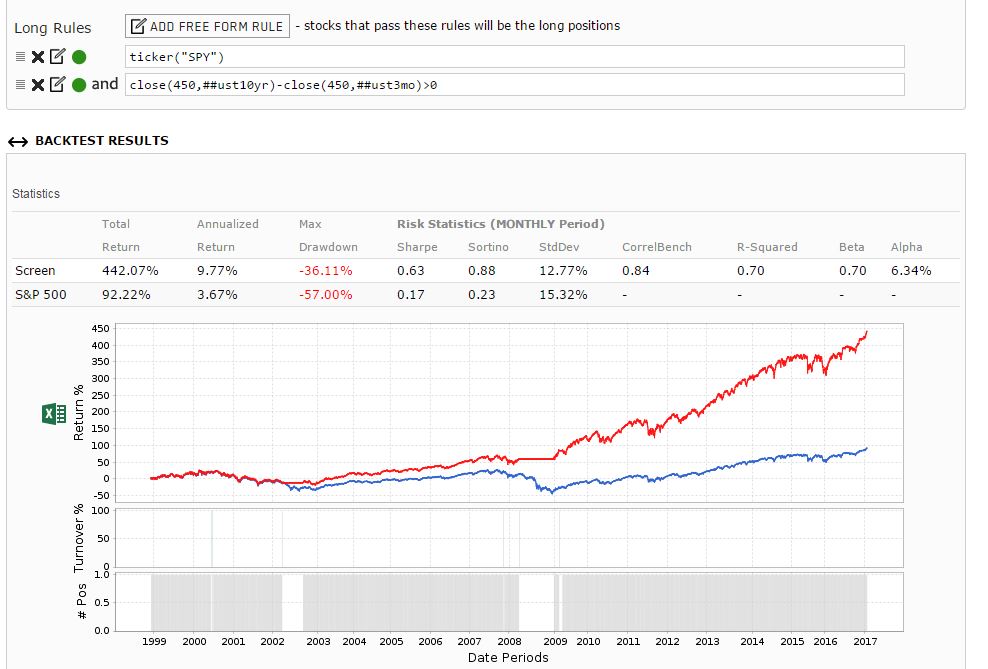
Since it’s a leading indicator, you can include an offset (see attached). This is just curve fitted for the last recession however. I haven’t done the analysis for previous recessions; perhaps others have.
Now that the Fed is manipulating things, will the effects of looking at inverted yield curves be distorted (or at least non predictive)? thoughts?
Agreed, thanks. I’ll play with the time frames, but you raise a good point about curve fitting. Thanks again.
I recently heard Barry Ritholz’s interview with Howard Marks on the Master in Business podcast. Howard believe that there is a lot information in corporate credit spreads as a proxy for risk appetite. A healthy risk appetite is, according to him, good for the stock market. On that idea of “taking the temperature of market”, before my fundamental analysis days, I played a lot with the notion of volatility spreads (i.e., VIX Index versus historical volatility) which I found to be a consistently good market timing tool – academic research bears this out as well.
Market timing is not my core strength, but I wanted to test this out. However, I got a weird chart which prevented me from going further…
If I buy and hold the SPY since 1/4/999 until 2/23/2017, I get an annualized RoR of 5.54% (this checks out on Yahoo! Finance data). However, the return for the S&P500 is only 3.67% over this time frame. I’m pretty sure that the delta is because there are no dividends in the benchmark.
Is this by design? How does the benchmark provide an apples-to-apples comparison when it does not include dividends, but my models do?
the benchmark SPDR S&P 500 ETF Trust is SPY
Hi PorfolioPerfection:
Could you please expand on the reason for subtracting one duration yield curve from another?
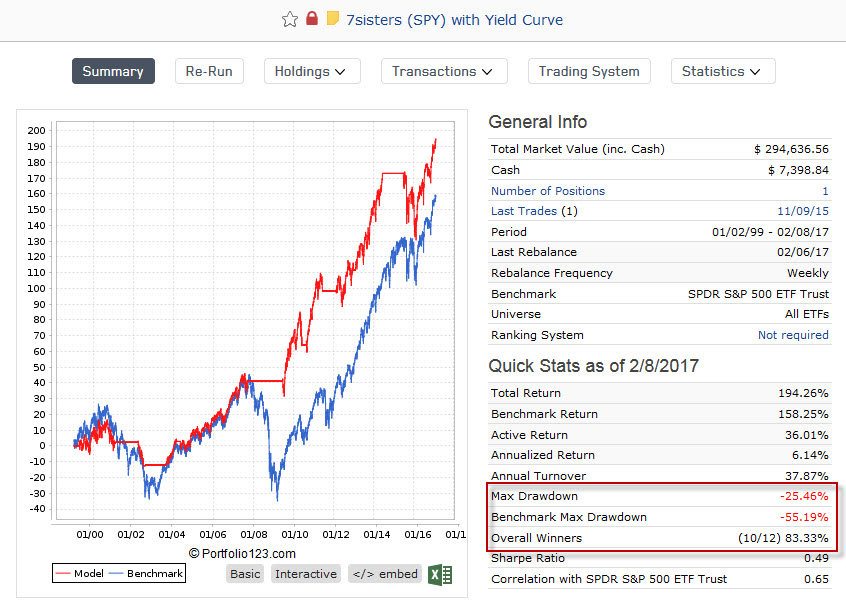
As an alternative approach, here a blend of the two curves.
Buy rule
Eval(EMA(50,0,##UST3MO)>EMA(200,0,##UST3MO) OR EMA(50,0,##UST10YR)>EMA(200,0,##UST10YR),ticker("SPY"),0)
Sell rule
ticker("SPY") AND EMA(50,0,##UST10YR)<EMA(200,0,##UST10YR) AND EMA(50,0,##UST3MO)<EMA(200,0,##UST3MO) AND NoDays>10
hth,
Florian
Hi Florian,
The rule is looking for an inverted yield curve. Actually, it wants to buy only when the yield curve is non-negative … you know what I mean.
From the linked paper;
Note that the paper also discusses the proposed 12 month lag in the indicator.
Walter
Florian,
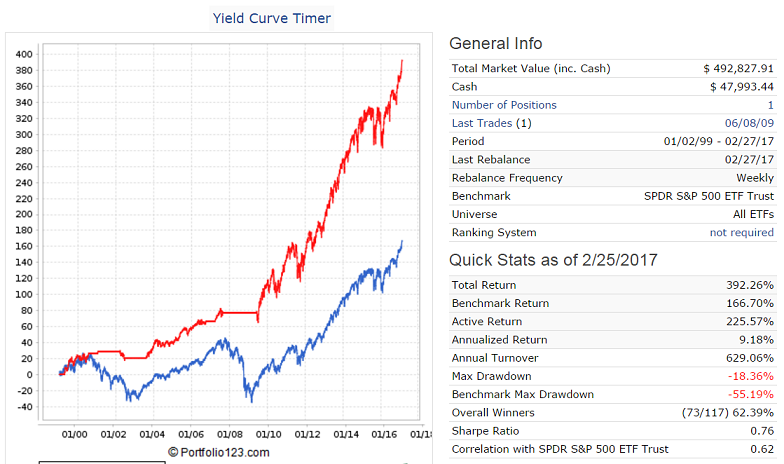
If one uses the Forward Rate Ratio between the 10 and 2 year Treasury yields as well, then one gets much better results.
Buy: Eval(((sma(5,0,##UST10yr)*5-sma(5,0,##UST2yr))/(sma(5,0,##UST10yr)*4))>1 and EMA(50,0,##UST3MO)>EMA(200,0,##UST3MO) OR EMA(50,0,##UST10YR)>EMA(200,0,##UST10YR),ticker(“SPY”),0)
Sell:ticker(“SPY”) & (sma(5,0,##UST10yr)*5-sma(5,0,##UST2yr))/(sma(5,0,##UST10yr)*4)<1.12
Question:
If you cut out the historical down markets a few times with a rule that may or may not be causally robust, isn’t that over-fitting?
I believe the statistical likelihood that a spurious correlation fits the data decreases as the (n_trials - 3) root. So, statistical power increase with sample size.
I am distrustful of market timing signals because I am intuitively suspicious of human nature which, in my view, prefers optimized solutions over robust ones. The likelihood of finding a pattern that fits is 100%; the likelihood that it will work going forwards seems suspect, especially for binary rules that only kick in every once in a while.
Thanks gents!
Georg, interestng to see the forward rate ratio used back all the way to 1968!
Georg,
ticker("SPY") & (sma(5,0,##UST10yr)*5-sma(5,0,##UST2yr))/(sma(5,0,##UST10yr)*4)<1.12What’s with all the “magic” numbers (i.e. 5, 4 and 1.12)? What is their basis?
Walter
Walter,
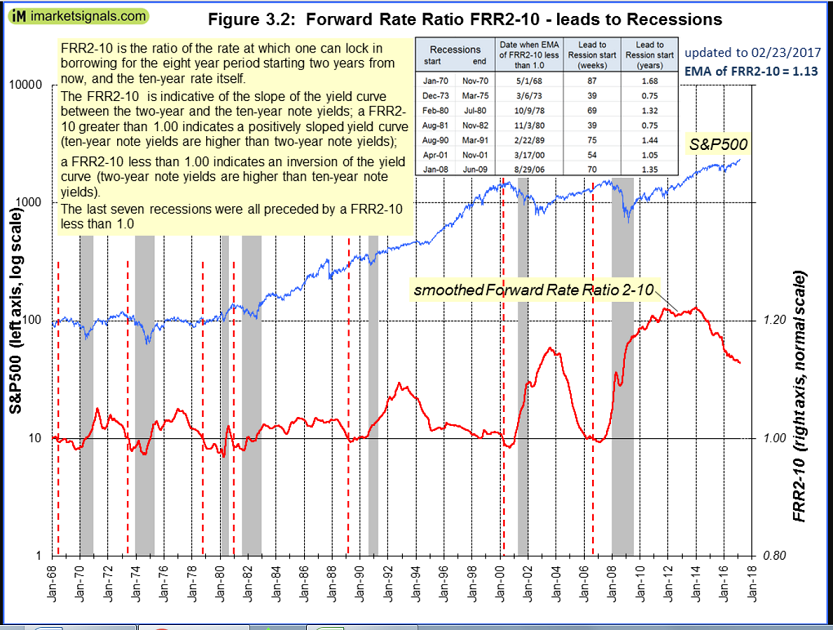
The Forward Rate Ratio between the 10-yr and 2-yr Treasury yields (FRR2-10) is the ratio of the rate at which one can lock in borrowing for the eight year period starting two years from now, and the ten-year rate itself.
The FRR2-10 is indicative of the slope of the yield curve between the two-year and the ten-year note yields; a FRR2-10 greater than 1.00 indicates a positively sloped yield curve (ten-year note yields are higher than two-year note yields); a FRR2-10 less than 1.00 indicates an inversion of the yield curve (two-year note yields are higher than ten-year note yields).
The last seven recessions were all preceded by a FRR2-10 less than 1.0.
The formula for calculating FRR2-10 is: FRR2-10 = { [(1 + i10)^10 / (1 + i2)^2 ]^1/8 -1} / i10
where i10 and i2 are the 10 year and 2 year U.S. Treasury Note yields respectively.
Neglecting compound interest: FRR2-10 = (5 i10 – i2 ) / 4 i10
I used this in the P123 model slightly smoothed: (sma(5,0,##UST10yr)*5-sma(5,0,##UST2yr))/(sma(5,0,##UST10yr)*4)
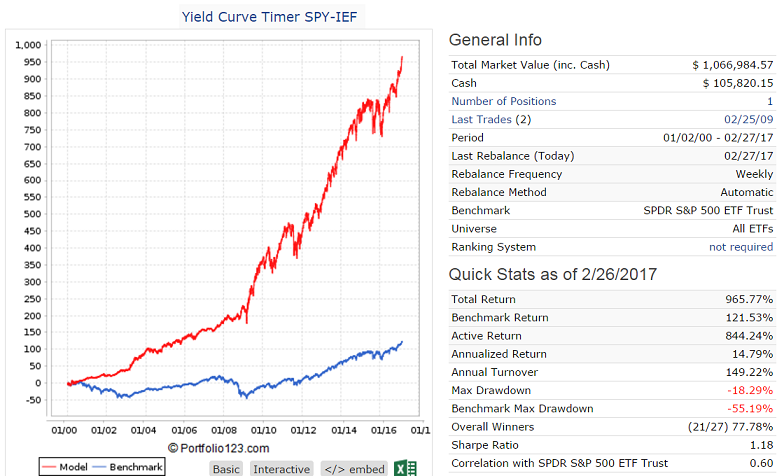
My model sells SPY when FRR2-10 < 1.12, but immediately buys SPY again if the buy rules are true.
Below is the model switching between SPY and IEF.
Hi Georg,
Thanks for the explanation. However, I can’t make the math work. To get forward rate into a form where the difference in rates appear, I end up with an extra scaling factor that is a function of ##UST2yr;
$r10 = sma(5,0,##UST10yr)/100
$r2 = sma(5,0,##UST2yr)/100
From https://en.wikipedia.org/wiki/Forward_rate
A literal translation of the simple forward rate is the first equation. The last equation is in a rate difference format. The 1/(1+2*$r2) factor should be included, I think.
$fr2to10 = (1/8)(((1+10$r10)/(1+2*$r2))-1) = (1/8)((10$r10-2*$r2)/(1+2*$r2))
I’m guessing that you believe that rates were low (small) enough to ignore the 1/(1+2*$r2) term.
Thanks,
Walter
Walter,
plug in some real historic values for i10 and i2 then you will see that the difference between the two formulas is very small.