All Stars: Greenblatt

Hi all,

I’m trying to find out how other users have found success with this ranking system, and what other factors work well with it in combination.

As an extreme case, see example below. GILD is in decline for over 1.5 years now, yet this ranking system gives it consistently a 99.80 rank within the S&P500.


I actually trade a similar system (GILD ranks highly there too) and I noticed this issue.

I tried many many different factors in combination with it but have not come up with a good automated solution.

In actual trading, I always read the latest writeups on SeekingAlpha before buying. If earnings are falling off a cliff (ex: if most of its income is from a fad product that is falling rapidly out of style or an oil driller when oil prices plummeted) it’s a huge red flag and I won’t buy it. If earnings are drifting downwards more gradually (such as a company that sells beepers), it’s a yellow flag; the cash coming in plus the cash on hand serves as a cushion to somewhat counteract the earnings decline. This cash may be used to do a big dividend or buy a good company which will help the stock price.

GILD seems to have a drug pipeline that is slowly expiring with no new drugs in sight, so it’s a yellow flag possibly bordering on red.

The good news is that overall the ranking system will beat the market despite this blind spot. That’s because the winners win big, and the losers usually go down slowly (like GILD). There is usually still a lot of cash coming in, there is cash in the bank, and the future decline in earnings is often gradual.

Do you have any other ideas?

I’ve tacked on a small weight of %Institutionally owned and Basic Sentiment Ranking to it just to (hopefully) cut off extreme tails of value traps. It’s improved performance just a little while still keeping the essential value logic behind the rank. In this case, it still has GILD ranked high (96) but not 99+.

I find that this ranking system does have its place. But jumps on value traps and massive drawdowns at times. Two things in combination that I find work: make sure there is some dividend yield and have a relative strength rule so you don’t but low momentum industry groups (e.g. Pr26WRel%ChgInd>=-5 and Pr13WRel%ChgInd>=-5).

Other than that, just follow his rules such as removing financial sector and utilities.

It is not an amazing ranking system but with some modifications it can work okay.

Bingo!

Actually, the most important thing you could have read would have been the first clause of the first sentence of a business description (from p123 panes), which says: “Gilead Sciences Inc., a research-based biopharmaceutical company . . . .”

That’s all you need to know. A Greenblatt ranking system cannot be expected to ever work for GILD (absent the luck-based appearance of working every now and then) because this ranking system (and all fundamental ranking systems) is based on factors that do not drive this stock. You would need to be working with a sentiment-terchnical-momentum based model.

This is why i almost never test ranking systems, expect when I’m doing something for publication. A ranking system can never stand separately from the group being ranked and considering how varied the universe is, that means we need to work with ranking systems as inextricably intertwined with screening/buy/sell rules that filter the universe and create narrow sub-groups to be ranked.

I had occasion earlier this week to mention on a TA thread the existence of platforms in that area that classify stocks based on personality, their amenability to various technical indicators. Perhaps it might be interesting to create uber-ratings for stocks. For example, GILD might rank 99 on Greenblatt, which would have an uber-score of 5 (best) in the category of fundamental models. But GILD’s fundamental uber-rank might be 1 (worst). In this kind of a world, you would set rules like UberR_F >=4 if you were using the Greenbltatt ranking system.

Don’t press me for details. I just invented this as I was typing. But it seems like an intriguing project. (I suppose my noise/value algorithms would help in coming up with uber-ranks. Thinking . . .

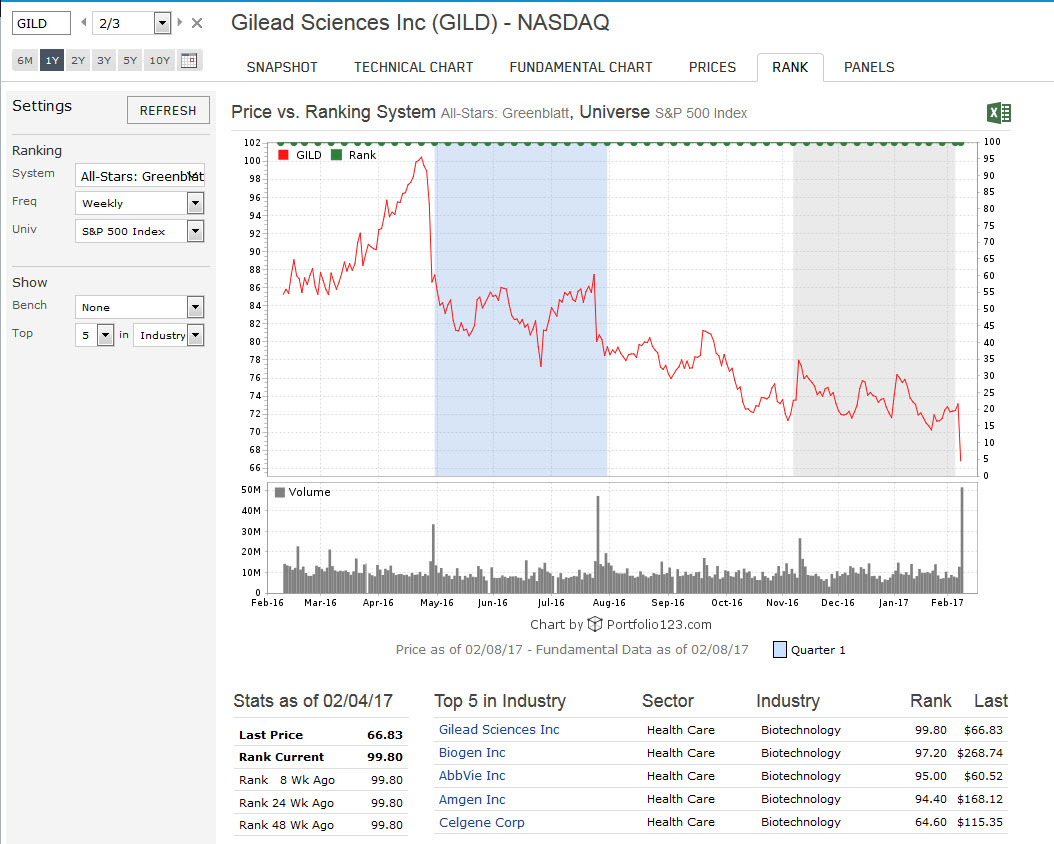
I am still long GILD but I understand why it scores highly on these ranking systems, whereas the share’s been declining for the past year or so.

The thing is… All these ranking systems have an implicit assumption in that the future will be reasonably similar to the past. What they are mostly angling for is mean reversion: the stock got beaten unfairly, priced below its intrinsic value and now it will revert to its justified price. This assumption doesn’t apply to companies like GILD because their business model is too unpredictable. Allow me to explain.

What’s happening with GILD is that their HCV drugs have cured most of their patient base - so they have stopped using it. They need new patients to purchase their drugs but (1) due to hefty price, insurers and Medicare/Medicaid only purchase these drugs for the sickest patients (2) to be able to sell more they are reducing the price, (3) other competitors such as ViiV are coming up with their own drugs to take market share. In the last earnings call, the CEO said that the HCV revenues were expected to decline from 14 billion in 2016 to 9 billion in 2017. The thing is, he may be just conservative because he may not really have much certainty. My point is that drug sales (especially curing drugs) can be so volatile that the info on past financial statements is not necessarily indicative of the future.

There are other issues in biotech as well. Lot of these companies have a monopoly on their drugs due to patent protections they enjoy. Once the patent protections expire, generic drug makers are allowed to produce biosimilar drugs, which undercut their profits. So once they “fall off the patent cliff”, it’s anybody’s guess how indicative their past performance will be.

You can also see a similar issue with energy companies. If I’m not mistaken, the Greenblatt Ranking/Magic Formula should perform much better in 2015 if you screen out the energy companies. In 2015, the gas prices hit rock bottom, which reduced the profits of the energy sector. Here, past financial statements are not indicative of future performance due to volatility of gas prices, thus Magic Formula and other fundamental analysis tools may not work as well. When you are buying an energy/gas/commodity/mining company, you are also placing a bet on the prices of gas/commodities/metals.

So you can simply filter out energy, biotech and mining companies. I think this improves the results somewhat for the Greenblatt ranker for the year 2015 - as it otherwise gives energy companies a high ranking for that year.

But as always, as Stephen Penman wrote in Accounting For Value, when buying a business, know the business. Screens can be useful but ultimately you have to make a judgment about the future profits of a company.

I’m slowly coming round to this conclusion as well.

Fiscal Momentum and Basic:Growth ranking systems do a decent job of tracking GILD. Makes sense if the market still perceives GILD as a growth company.

Why not use the Transactions > Realized then Aggregate by Sector or Industry to see how the historical holdings of a portfolio have done in a particular sector or industry?

good idea

Or you could subscribe to my model :slight_smile:

https://www.portfolio123.com/app/r2g/summary?id=1396385

Steve

<>

I was going to add… If you had a SalesTTM > SalesPTM filter, that would have also discarded GILD.

Everybody knew the sales were declining. A lot of it was priced in - nobody knew just how big the fall would be.

A lot of these models are aiming for a mean reversion in sales, so that the price also bounced back. But I don’t think we are getting that mean reversion because the patient base is getting cured and shrinking.

Ugh. Can we say lookback bias? Now that we know that GILD has been declining for 1 1/2 years, we try to come up with a rule that would exclude it without just coming right out and saying “exclude GILD”.

I tried a number of suggestions, and some exluded GILD while others didn’t — but they all had lower CAGR than the original screen. So then I tried just excluding BIOTECH. That got rid of GILD all right. But had virtually no effect on the results. CAGR, sharpe, sortino, maxdd, stdev were all just about the same.

Looking at the graphs, it appears that the problem is not GILD or biotech, the problem is that Greenblatt’s MFI hit a wall in 2014 and has gone nowhere for the last 3 years.

Agreed. But I’m not sure this model is as dead as some fear. I do think that this model works during normal economic periods, i.e., when a typical yield curve (meaning yield spreads that encourage lending) leads to intelligent capital allocation and value strategies are thereby rewarded accordingly. When the Fed has been the only game in town and has forced down yields in order to keep the economy afloat, price discovery has been distorted. Hopefully we will get to better fiscal policy ahead, rates will rise (a little), and value/Greenblatt will assert itself again.

Say, a different question - does anyone remember seeing Newlink Genetics (ticker NLNK) in their Greenblatt screens in late 2015/early 2016? I wish I had saved a screen shot, because it definitely was a Magic Formula “buy” at that time and now I go back to that time period here and it doesn’t appear. I swear P123 seems to have some data gremlins, stocks appearing and then later disappearing when you later try to recreate a buy list for that same time period.