Full Description
This function finds stocks with a Gap Down pattern, which occurs when the high for a bar is lower than the previous bar's low. Gaps usually represent important areas of support or resistance.
Parameters
GapPct: Specifies the minimum Gap size in absolute percentage. A value of '10' will find stocks that have gap size of at least 10%.
VolPct: Specifies the minimum volume increase in percentage during the gap from the 20-bar average. A Gap Down is more significant if it occur with a large spike in volume.
Bars: Specifies the length of the period in which to look for the Gap Down pattern.
Offset: Specifies the start of the period. Use 0 to start looking from the latest bar.
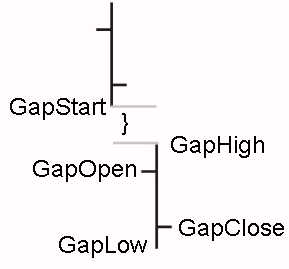
Additional Variables (see image)
If the function returns TRUE (1), additional variables become available to use in the formula. These variables must be used to the right of the function in the same rule. The variables are:
GapStart: The Low from the bar previous to the gap
GapOpen: The Open price in the gap bar
GapHigh: The High price in the gap bar
GapLow: The Low price in the gap bar
GapClose: The Close price in the gap bar
GapBar: How many bars ago the gap occurred
For example to find stocks that have had a Gap Down pattern of at least 20%, with a volume increase of at least 500%, has occurred in the last 20 bars, and that are still trading below the gap, enter the following:
GapDown(20,500,20,0) and Close(0) < GapHigh

